☁️ Trend Fluctuation Cloud Strategy
📊 Trends don’t rise linearly; they advance with fluctuations in a “structured progression.”
TFC (Trend Fluctuation Cloud) is an intelligent trend indicator that combines trend strength with volatility stability.
Its goal is simple: Capture trends in chaos and stay calm amid fluctuations.
1. TFC Indicator Overview
Traditional moving average indicators (e.g., EMA, SMA) focus solely on “direction,” but TFC emphasizes the quality and reliability of trends.
It dynamically assesses market volatility, adjusts trend lines with weighted calculations, reduces sensitivity during high volatility, and increases responsiveness during converging ranges, enabling smoother and more stable trend detection.
This is why TFC is called an “Adaptive Trend Structure Identification System.”
2. Core Concept (Simplified)
TFC Core Logic: Trend = Direction + Stability
- Trend Direction: Defined by the smoothed trajectory of closing prices.
- Trend Stability: Determined by the relative strength of real-time volatility compared to historical volatility.
- Cloud Structure: Generated by smoothing and overlaying multiple price sources (open, high, low, close) to create a visualized “trend strength cloud zone.”
- When the cloud is green, a bullish trend dominates.
- When the cloud turns red, a bearish trend prevails.
- Changes in cloud thickness indicate the market entering a new phase of volatility.
3. Applicable Timeframes (Detailed)
| Timeframe | Use Case | Characteristics |
|---|---|---|
| 1-minute (1m) | High-frequency scalping, quant bot strategies | Ultra-sensitive, ideal for capturing short-term reversals |
| 3-minute (3m) | High-frequency short-term, pullback confirmation | More accurate fake breakout filtering with volume |
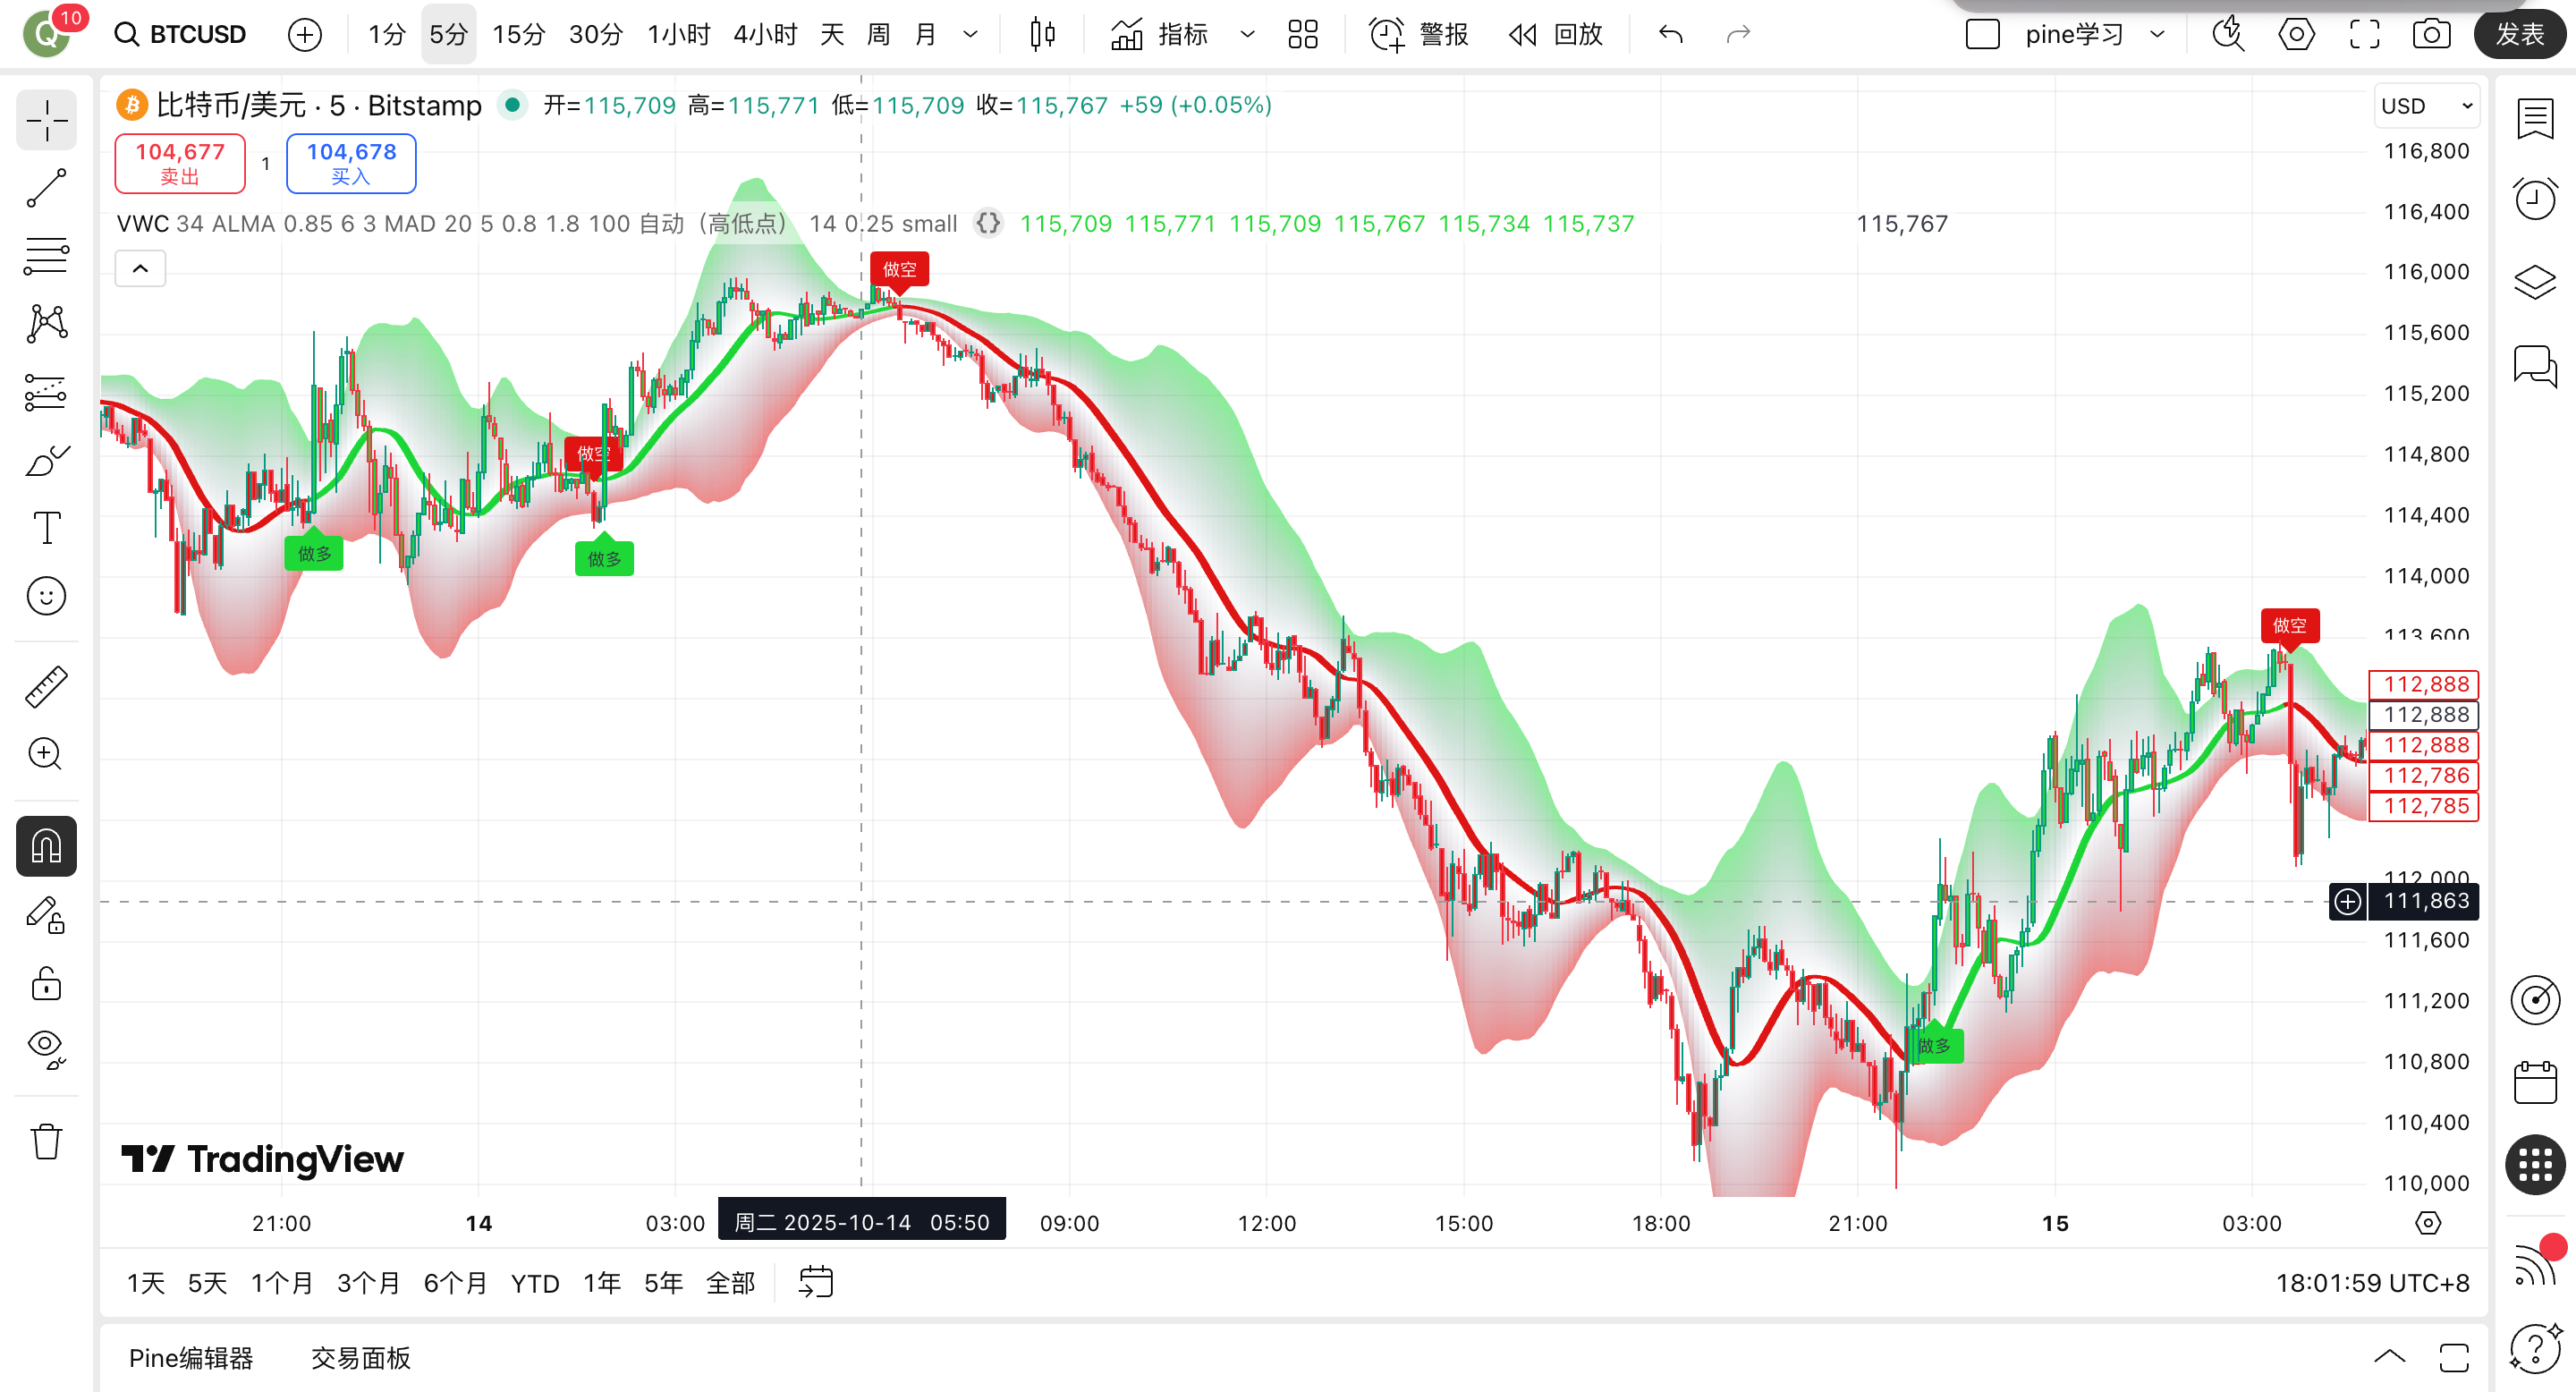
| 5-minute (5m) | Intraday trend main chart | Highly recommended, balanced signals with low noise |
| 15-minute (15m) | Intraday mid-term trends | Suitable for following structural swings, higher tolerance |
| 30-minute (30m) | Short-term swing trading | Useful for confirming momentum shifts in longer rhythms |
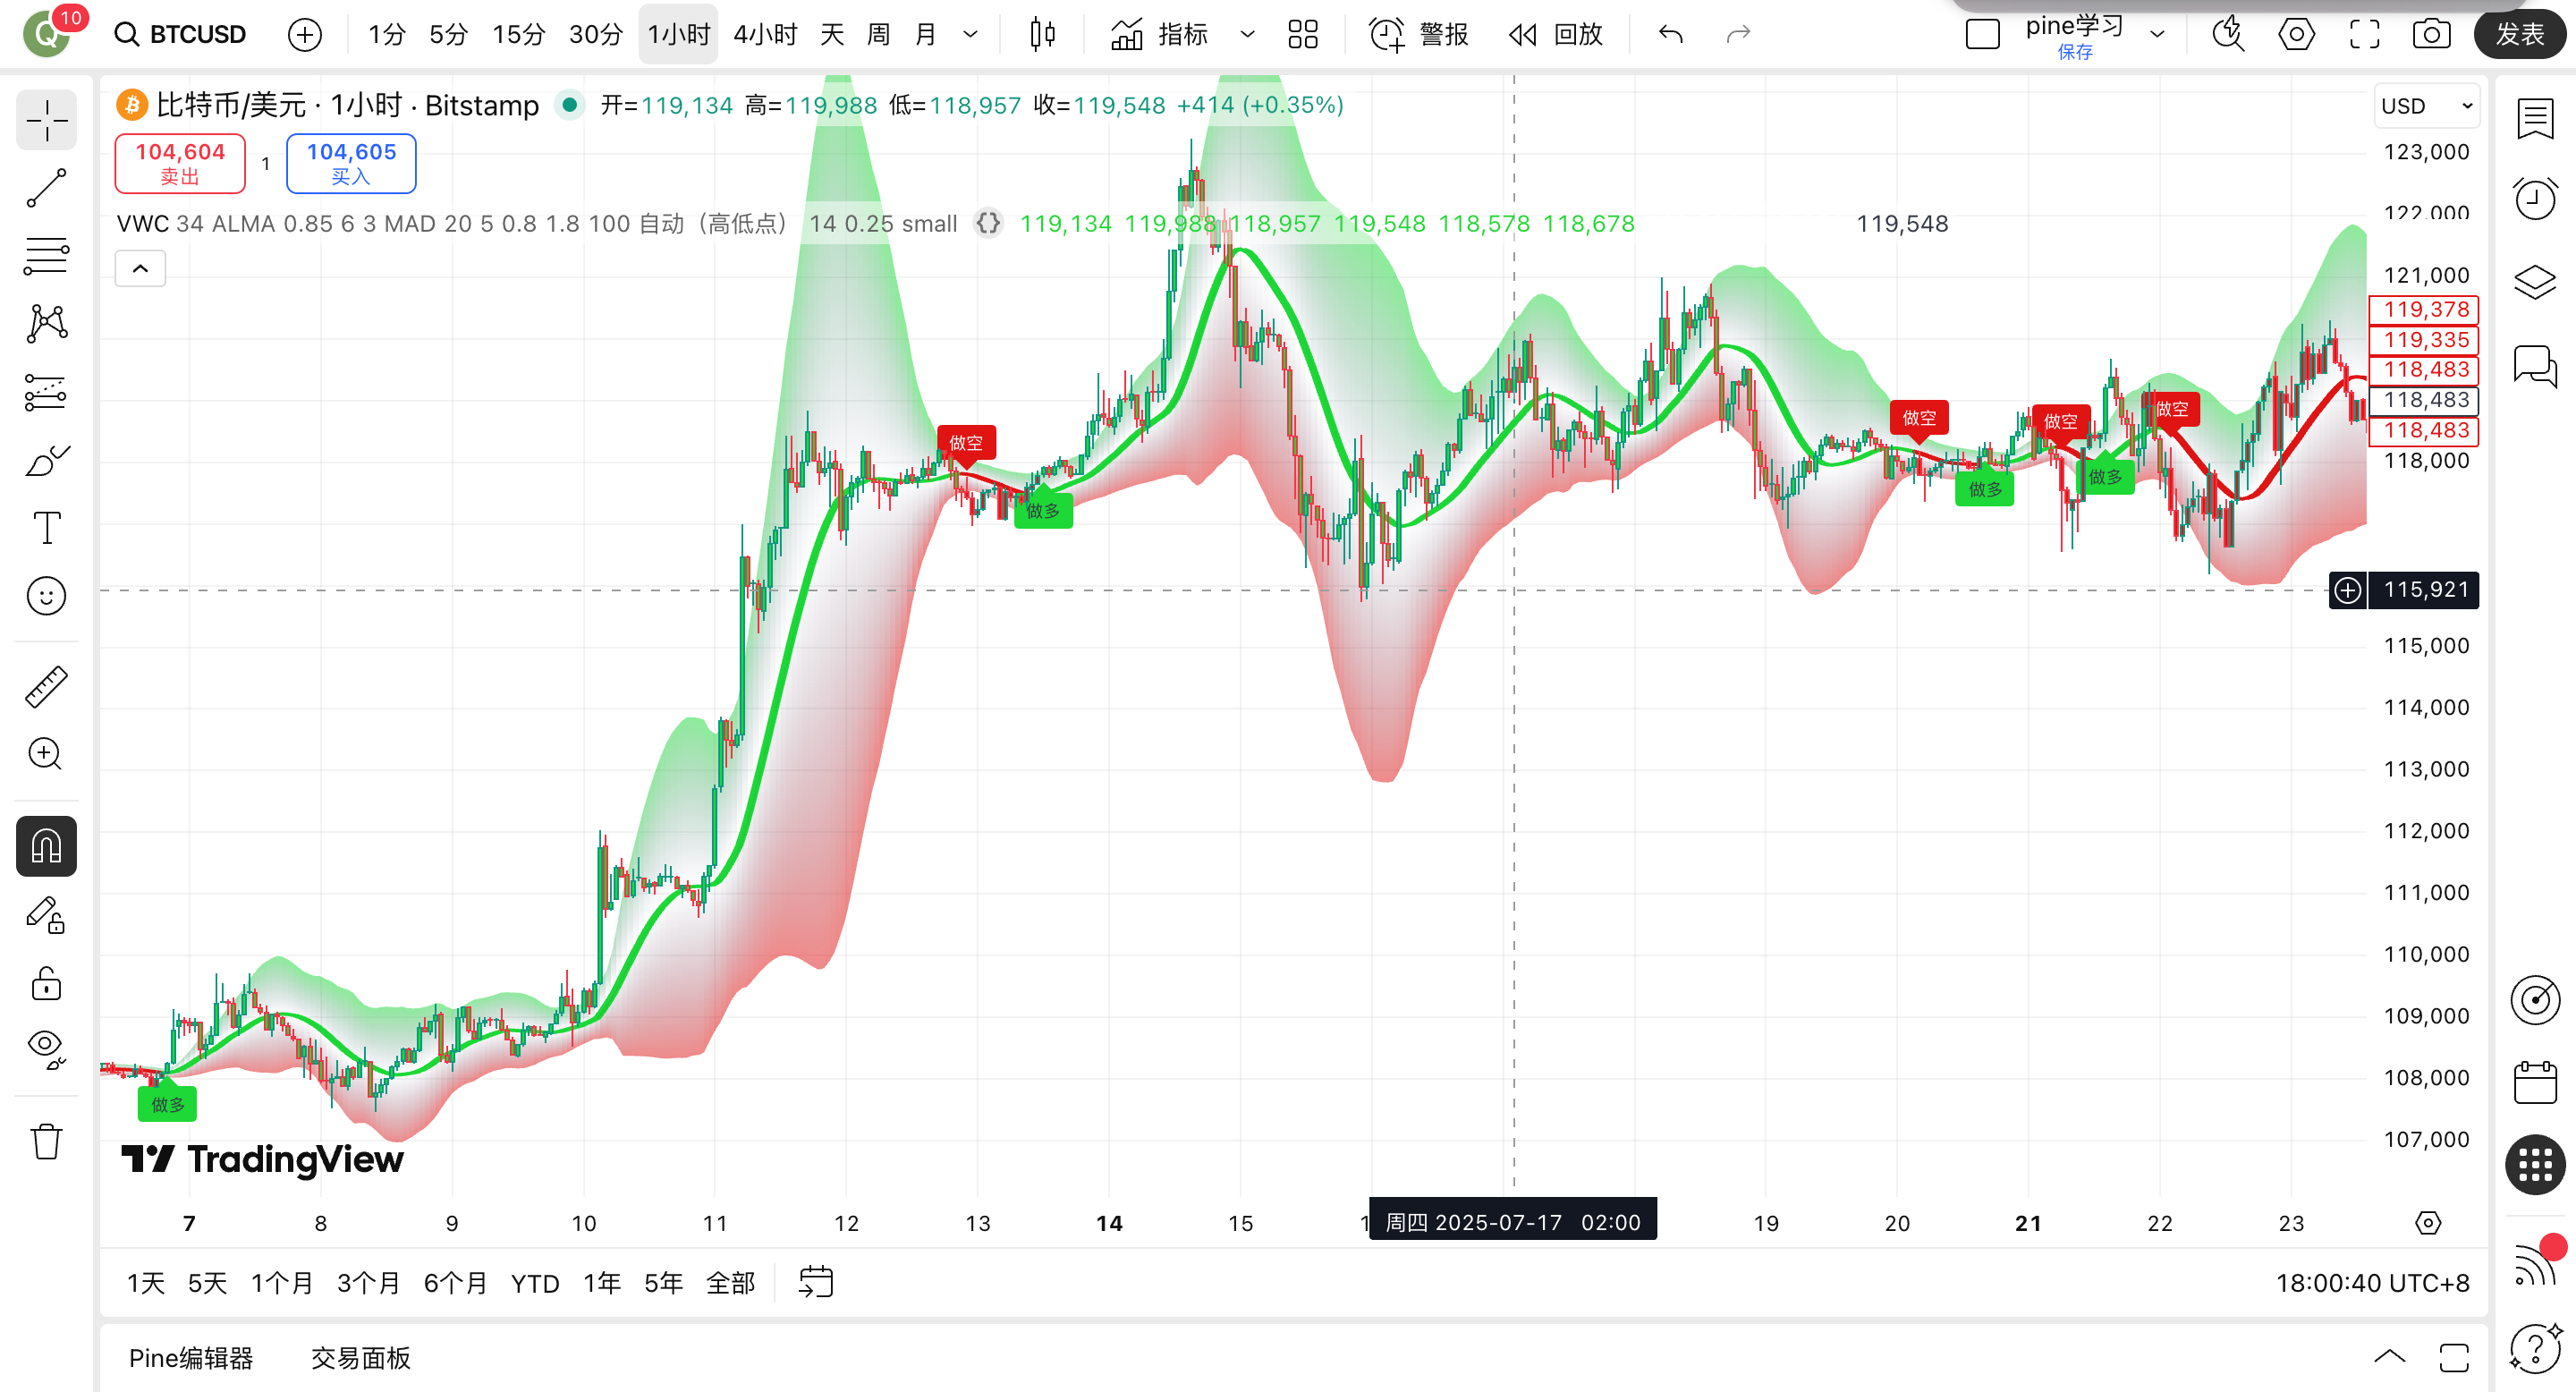
| 1-hour (1h) | Swing trends, short- to mid-term trading | Low noise, smooth trends, ideal for main rhythm analysis |
| 4-hour (4h) | Trend cycle confirmation | Use with 1h for trend-level resonance analysis |
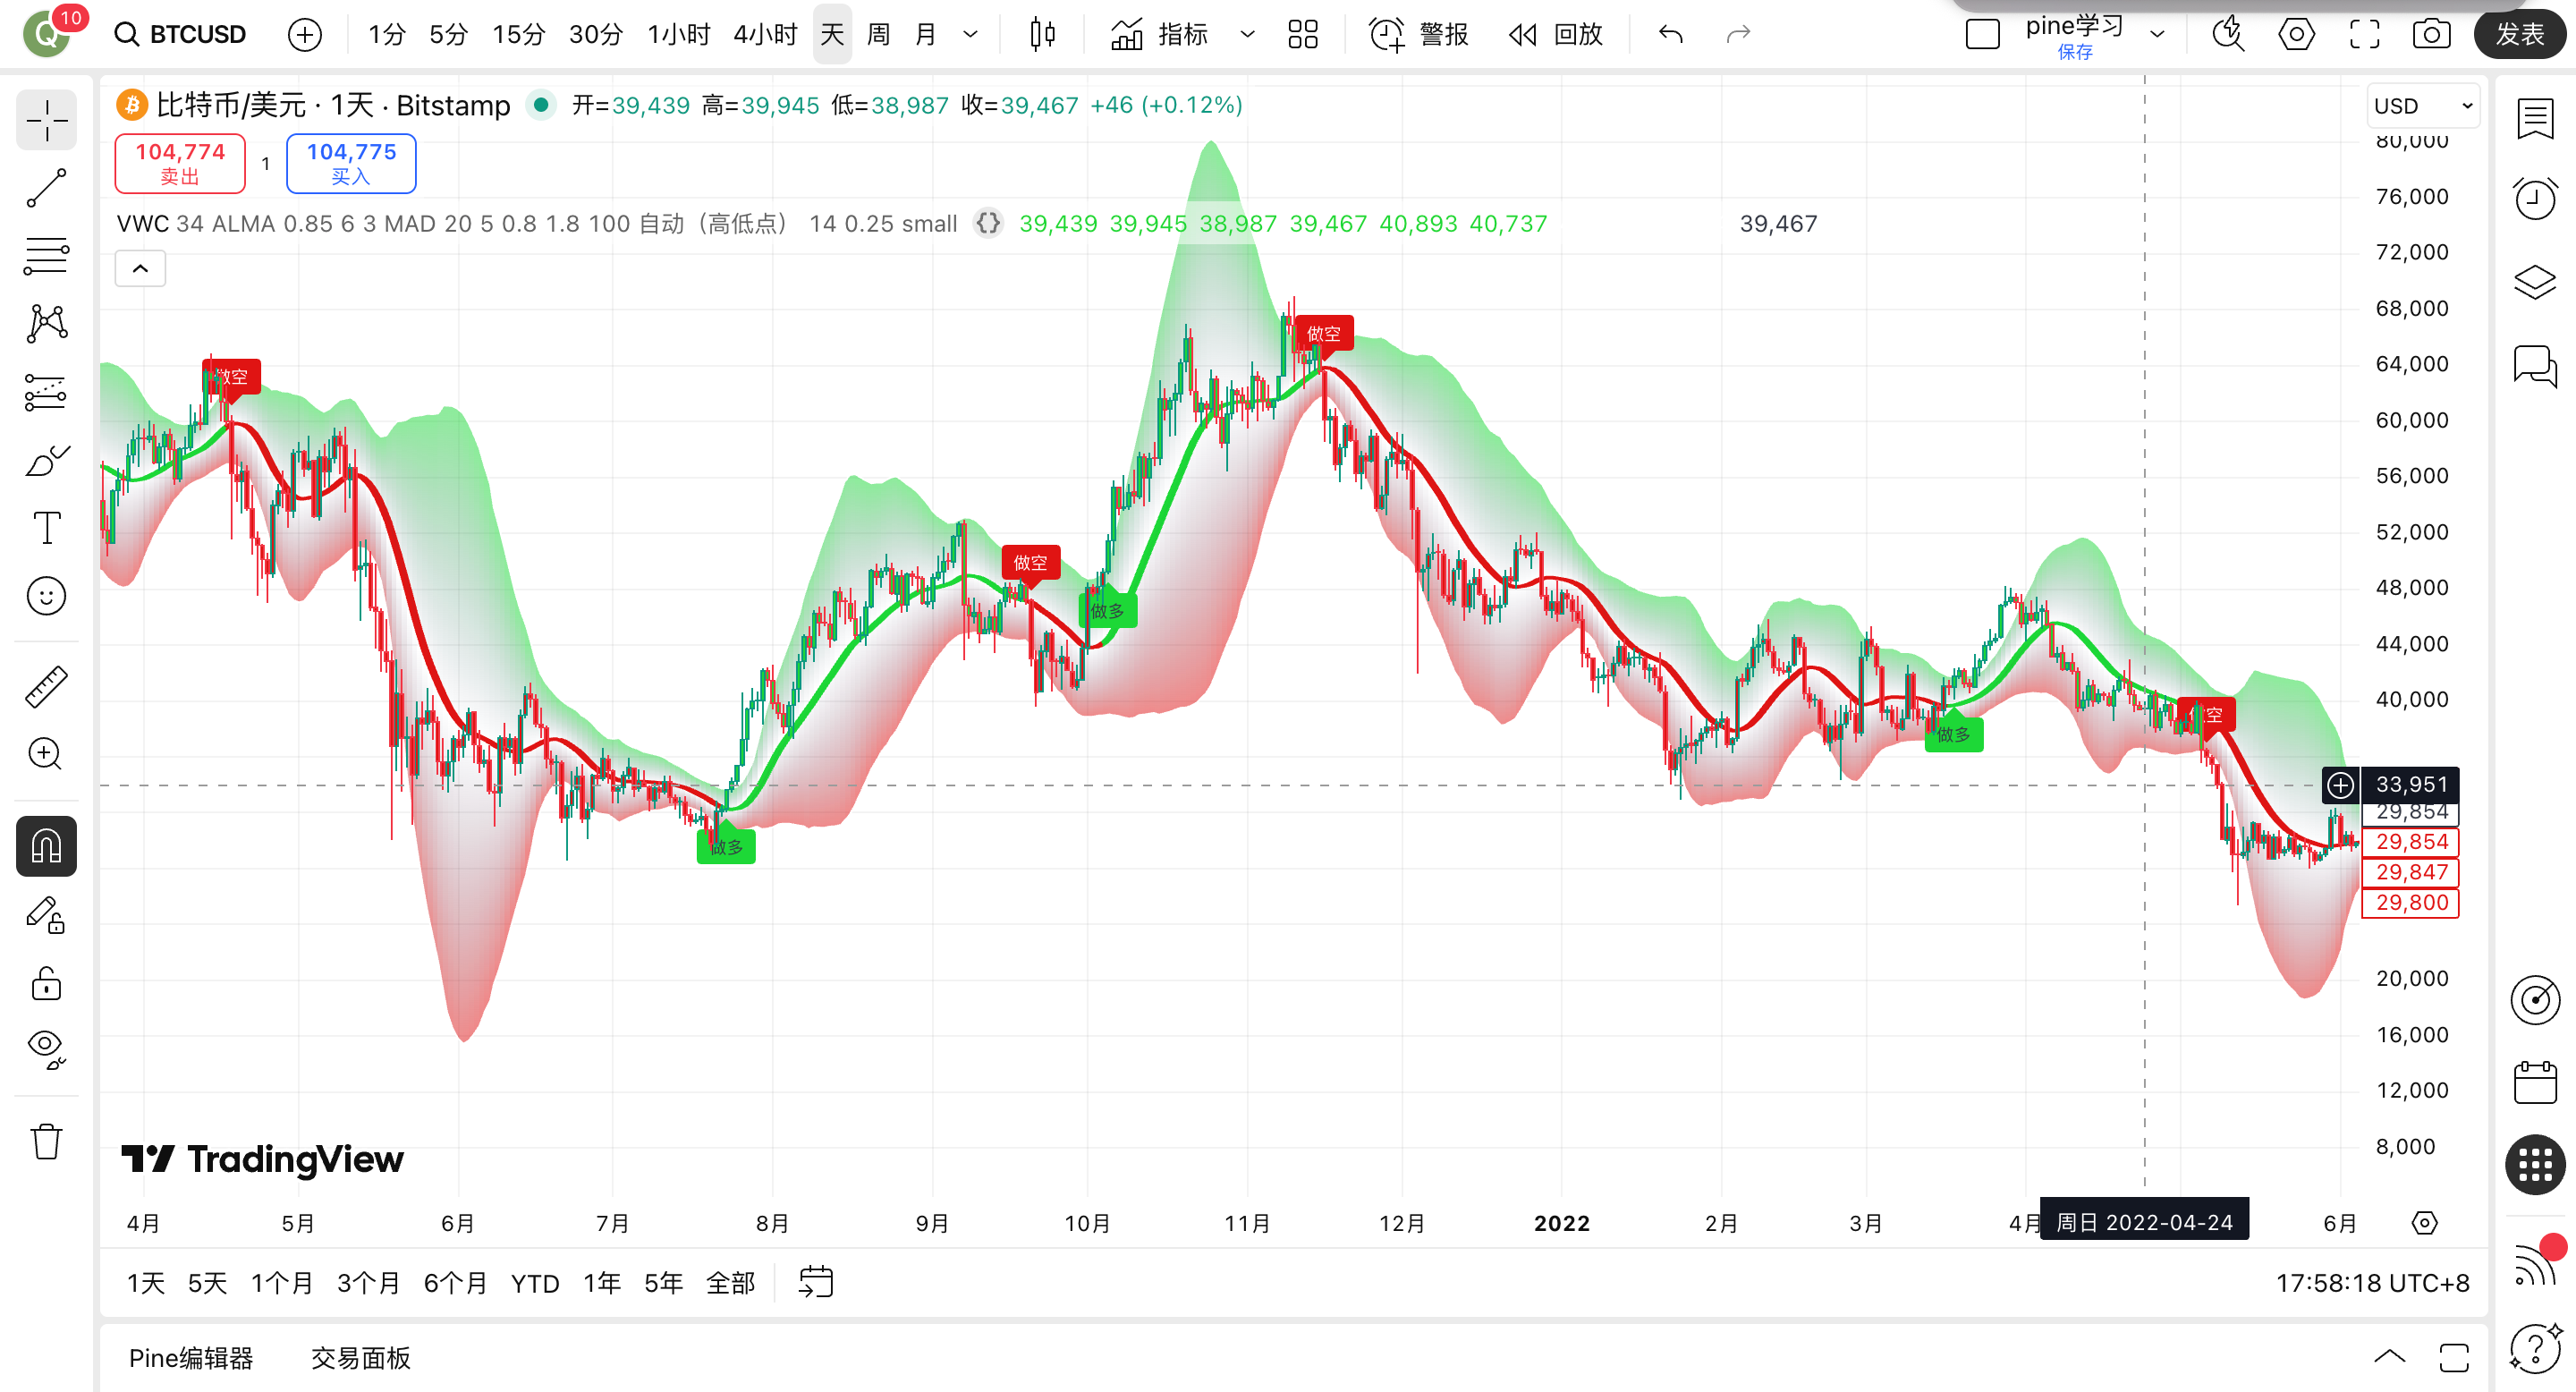
| Daily (1D) | Mid- to long-term trend following | Highest stability, supports large capital position management |
📌 Recommendations:
- High-frequency trading: Focus on 1m–5m timeframes.
- Manual trading or swing strategies: Use 1h, 4h, or 1D timeframes for joint analysis.
4. Signal Usage Logic
✅ Cloud Color Change Signal
When the cloud changes from green → red or red → green, it signals a trend direction shift.
This can be used as an entry point for trend-following or reversal strategies.✅ Price Breaking Cloud Boundary
- Closing price breaks above the upper cloud boundary → Bullish acceleration.
- Closing price breaks below the lower cloud boundary → Bearish strengthening.
- Thicker clouds indicate stable trends; thinner clouds suggest an impending turning point.
5. Performance Showcase
6. Take Profit and Stop Loss Recommendations (General Framework)
❗ Any trend system must be used with proper risk management.
🎯 Take Profit Recommendations
When the price moves far from the cloud and volatility spikes, consider partial profit-taking or trailing stops to lock in gains.🛑 Stop Loss Recommendations
- Bullish: Set stop loss below the lower cloud boundary.
- Bearish: Set stop loss above the upper cloud boundary.
- Exit promptly if a reversal signal is triggered.
⏱️ Position Sizing
- High-frequency timeframes (1m, 5m): Use light positions.
- Trend timeframes (1h, 4h): Moderate position sizing, but avoid chasing highs or lows.
Trend Fluctuation Cloud Indicator
Currently provided in open-source sharing mode. In the future, it may switch to a subscription model with closed source. Please seize this opportunity.