☁️ Trend Breakout Indicator
📊 The Trend Breakout Indicator is a trend identification tool combining EMA, ATR, and ADX.
Its core objective is to capture breakout signals during clear trends while reducing false signals in ranging markets.
1. Indicator Overview
The Trend Breakout Indicator uses three core components to assess market conditions:
- EMA (Exponential Moving Average): Identifies the average price direction to determine the primary trend.
- ATR (Average True Range) Volatility Band: Measures price volatility and creates upper and lower trend lines, forming a "breakout buffer zone."
- ADX (Average Directional Index) Trend Strength: Filters out low-strength trends to avoid false signals in choppy markets.
The indicator prioritizes reliable signals over frequent signals, generating buy/sell signals only when the trend is clear, the price breaks the buffer zone, and ADX is sufficiently strong.
2. Core Logic
| Step | Description |
|---|---|
| 1. EMA Calculation | Calculates two EMAs (fast and slow) to determine the trend direction. |
| 2. ATR Trend Zone | Upper band = EMA1 + ATR × multiplier; Lower band = EMA1 - ATR × multiplier, forming the breakout buffer zone. |
| 3. ADX Trend Strength | Manually calculates ADX; breakout signals are valid only when ADX meets the threshold. |
| 4. Breakout Detection | Close price breaks above upper band & ADX ≥ threshold → Bullish signal; Close price breaks below lower band & ADX ≥ threshold → Bearish signal. |
| 5. Signal Deduplication | Prevents repeated signals on consecutive candles; new signals are displayed only when the trend direction changes. |
3. Signal Interpretation
Bullish Breakout (Buy)
- Condition: Close price breaks above the upper band, and ADX ≥ threshold.
- Visualization: A "B" label appears below the candle.
- Meaning: Strong upward trend, suitable for entering a long position.
Bearish Breakout (Sell)
- Condition: Close price breaks below the lower band, and ADX ≥ threshold.
- Visualization: An "S" label appears above the candle.
- Meaning: Clear downward trend, suitable for entering a short position.
Range Filter
- When the price is between the upper and lower bands and ADX < threshold, no trading signals are generated.
- This avoids frequent entries and improves signal reliability.
5. Visualization and Alerts
- EMA Lines: Black (EMA1), Blue (EMA2).
- Breakout Zone: Upper band (cyan), Lower band (red).
- Breakout Markers: B (Bullish), S (Bearish).
- Alert Settings:
🔔 Alerts can be set up in TradingView for automatic notifications.
6. Performance Showcase
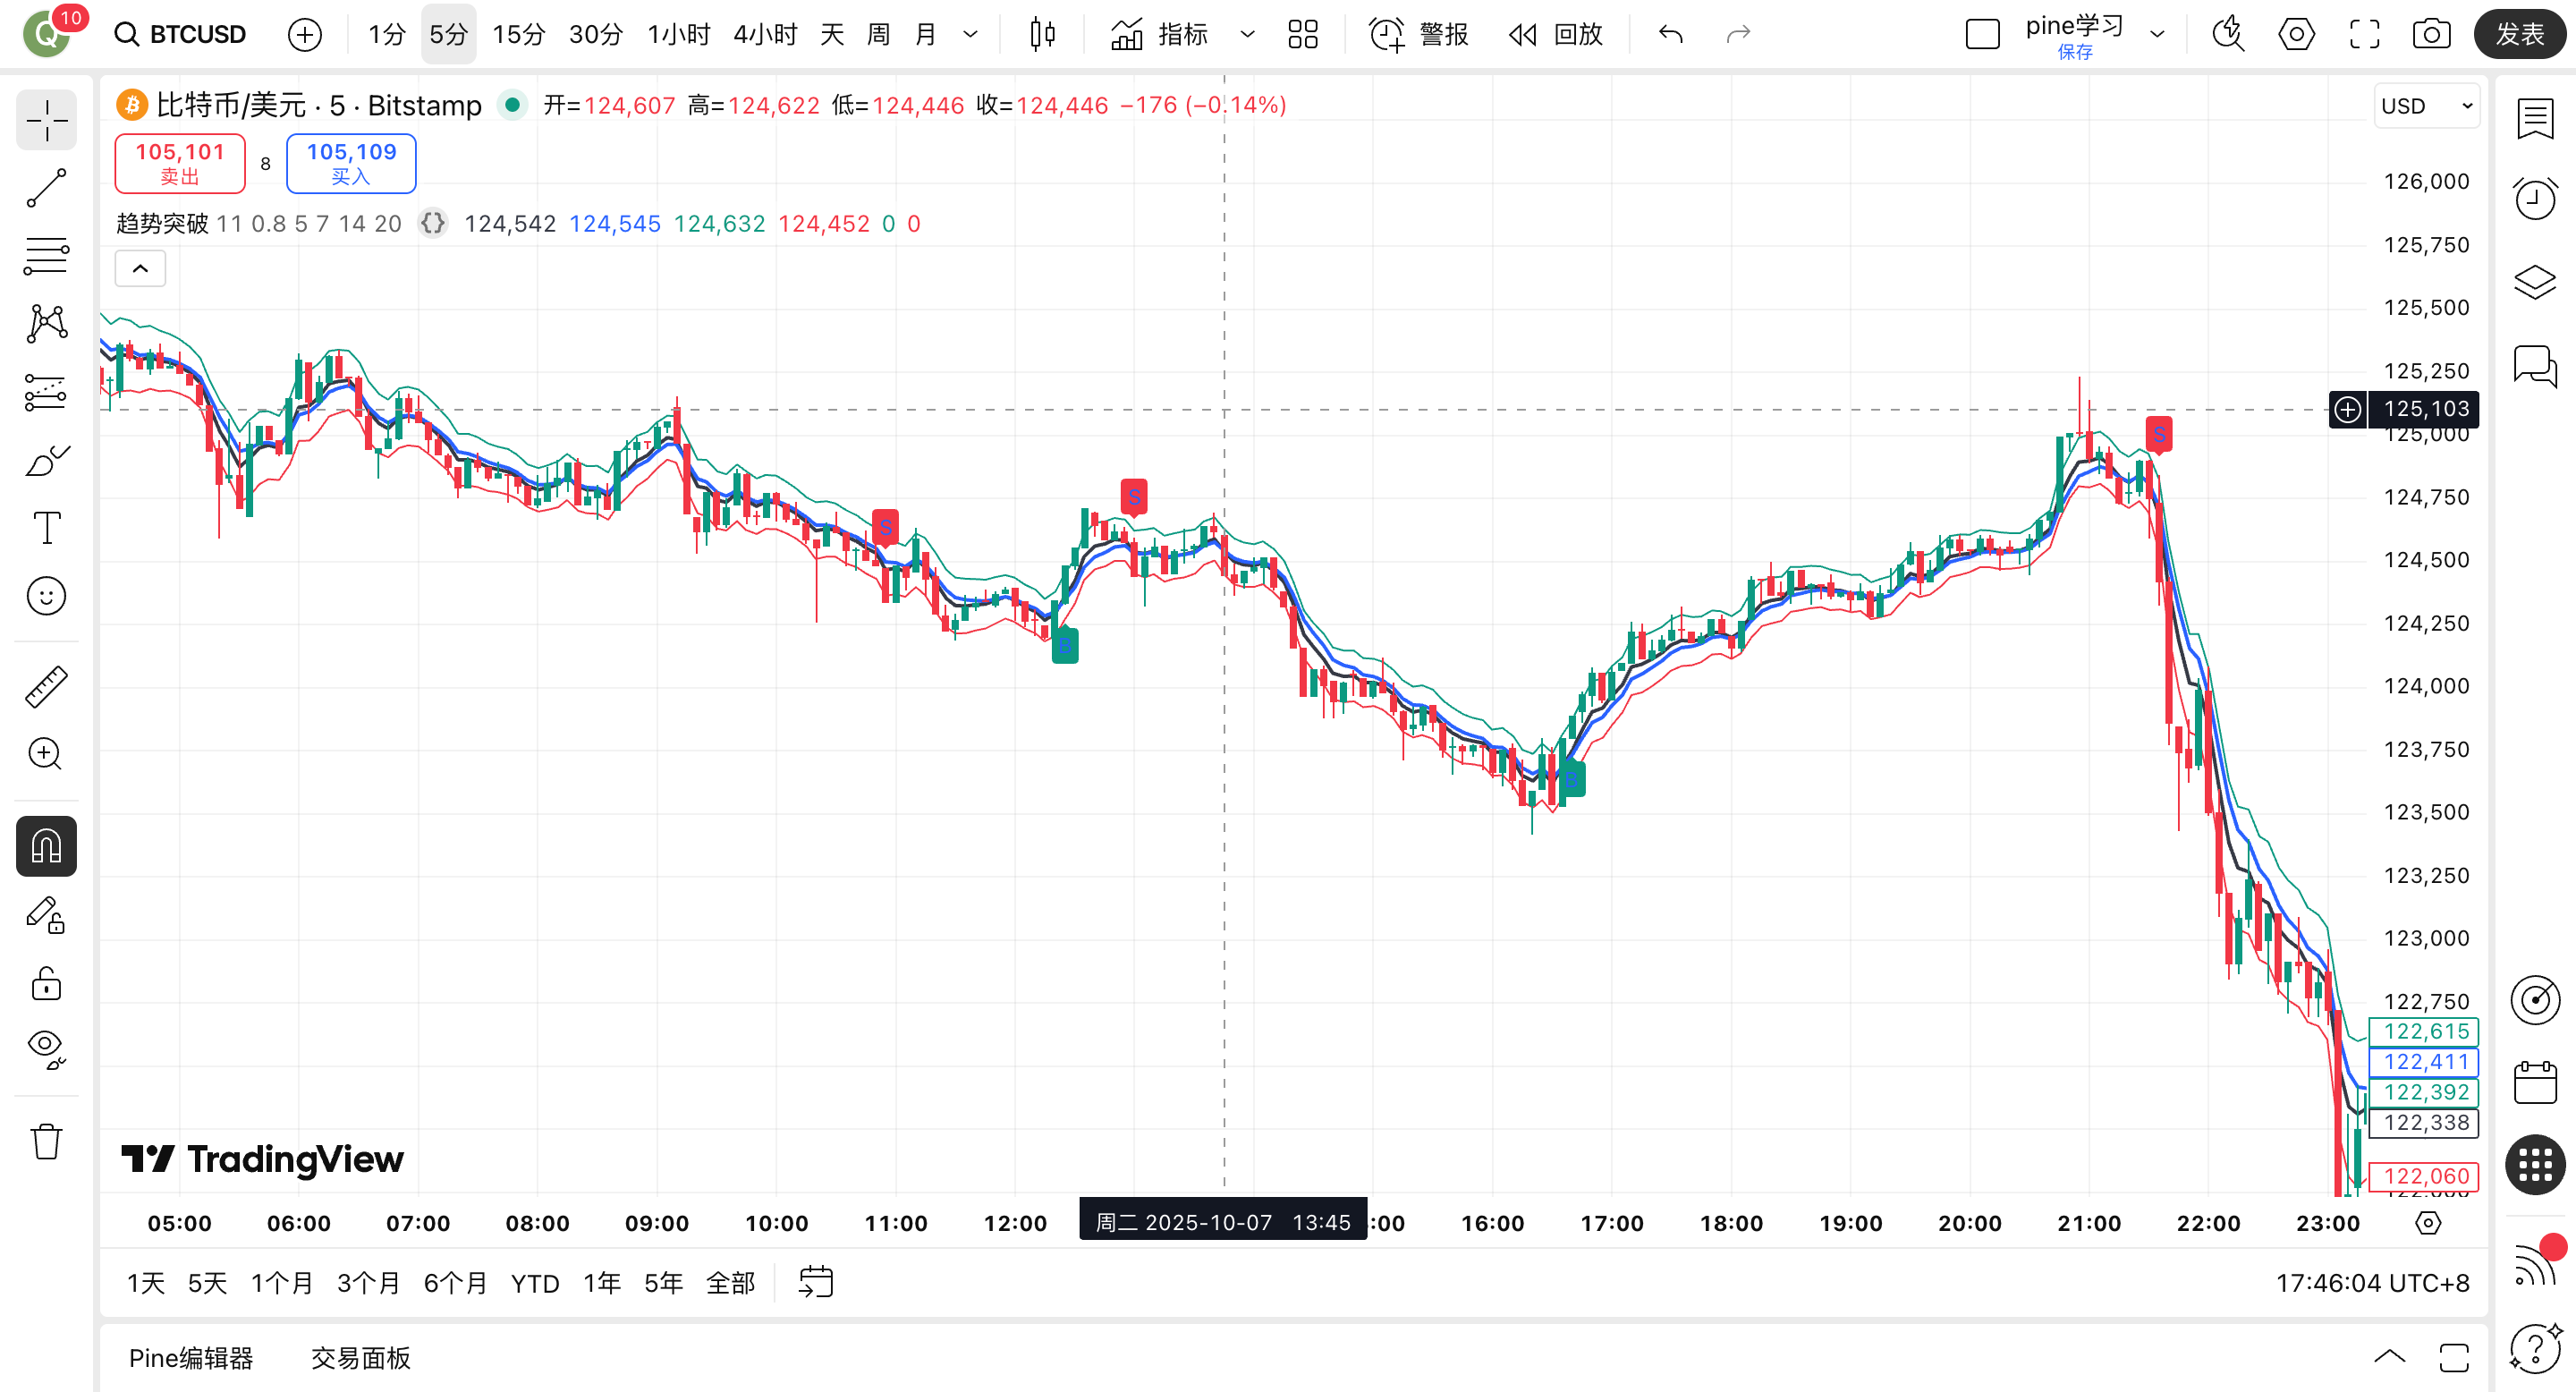
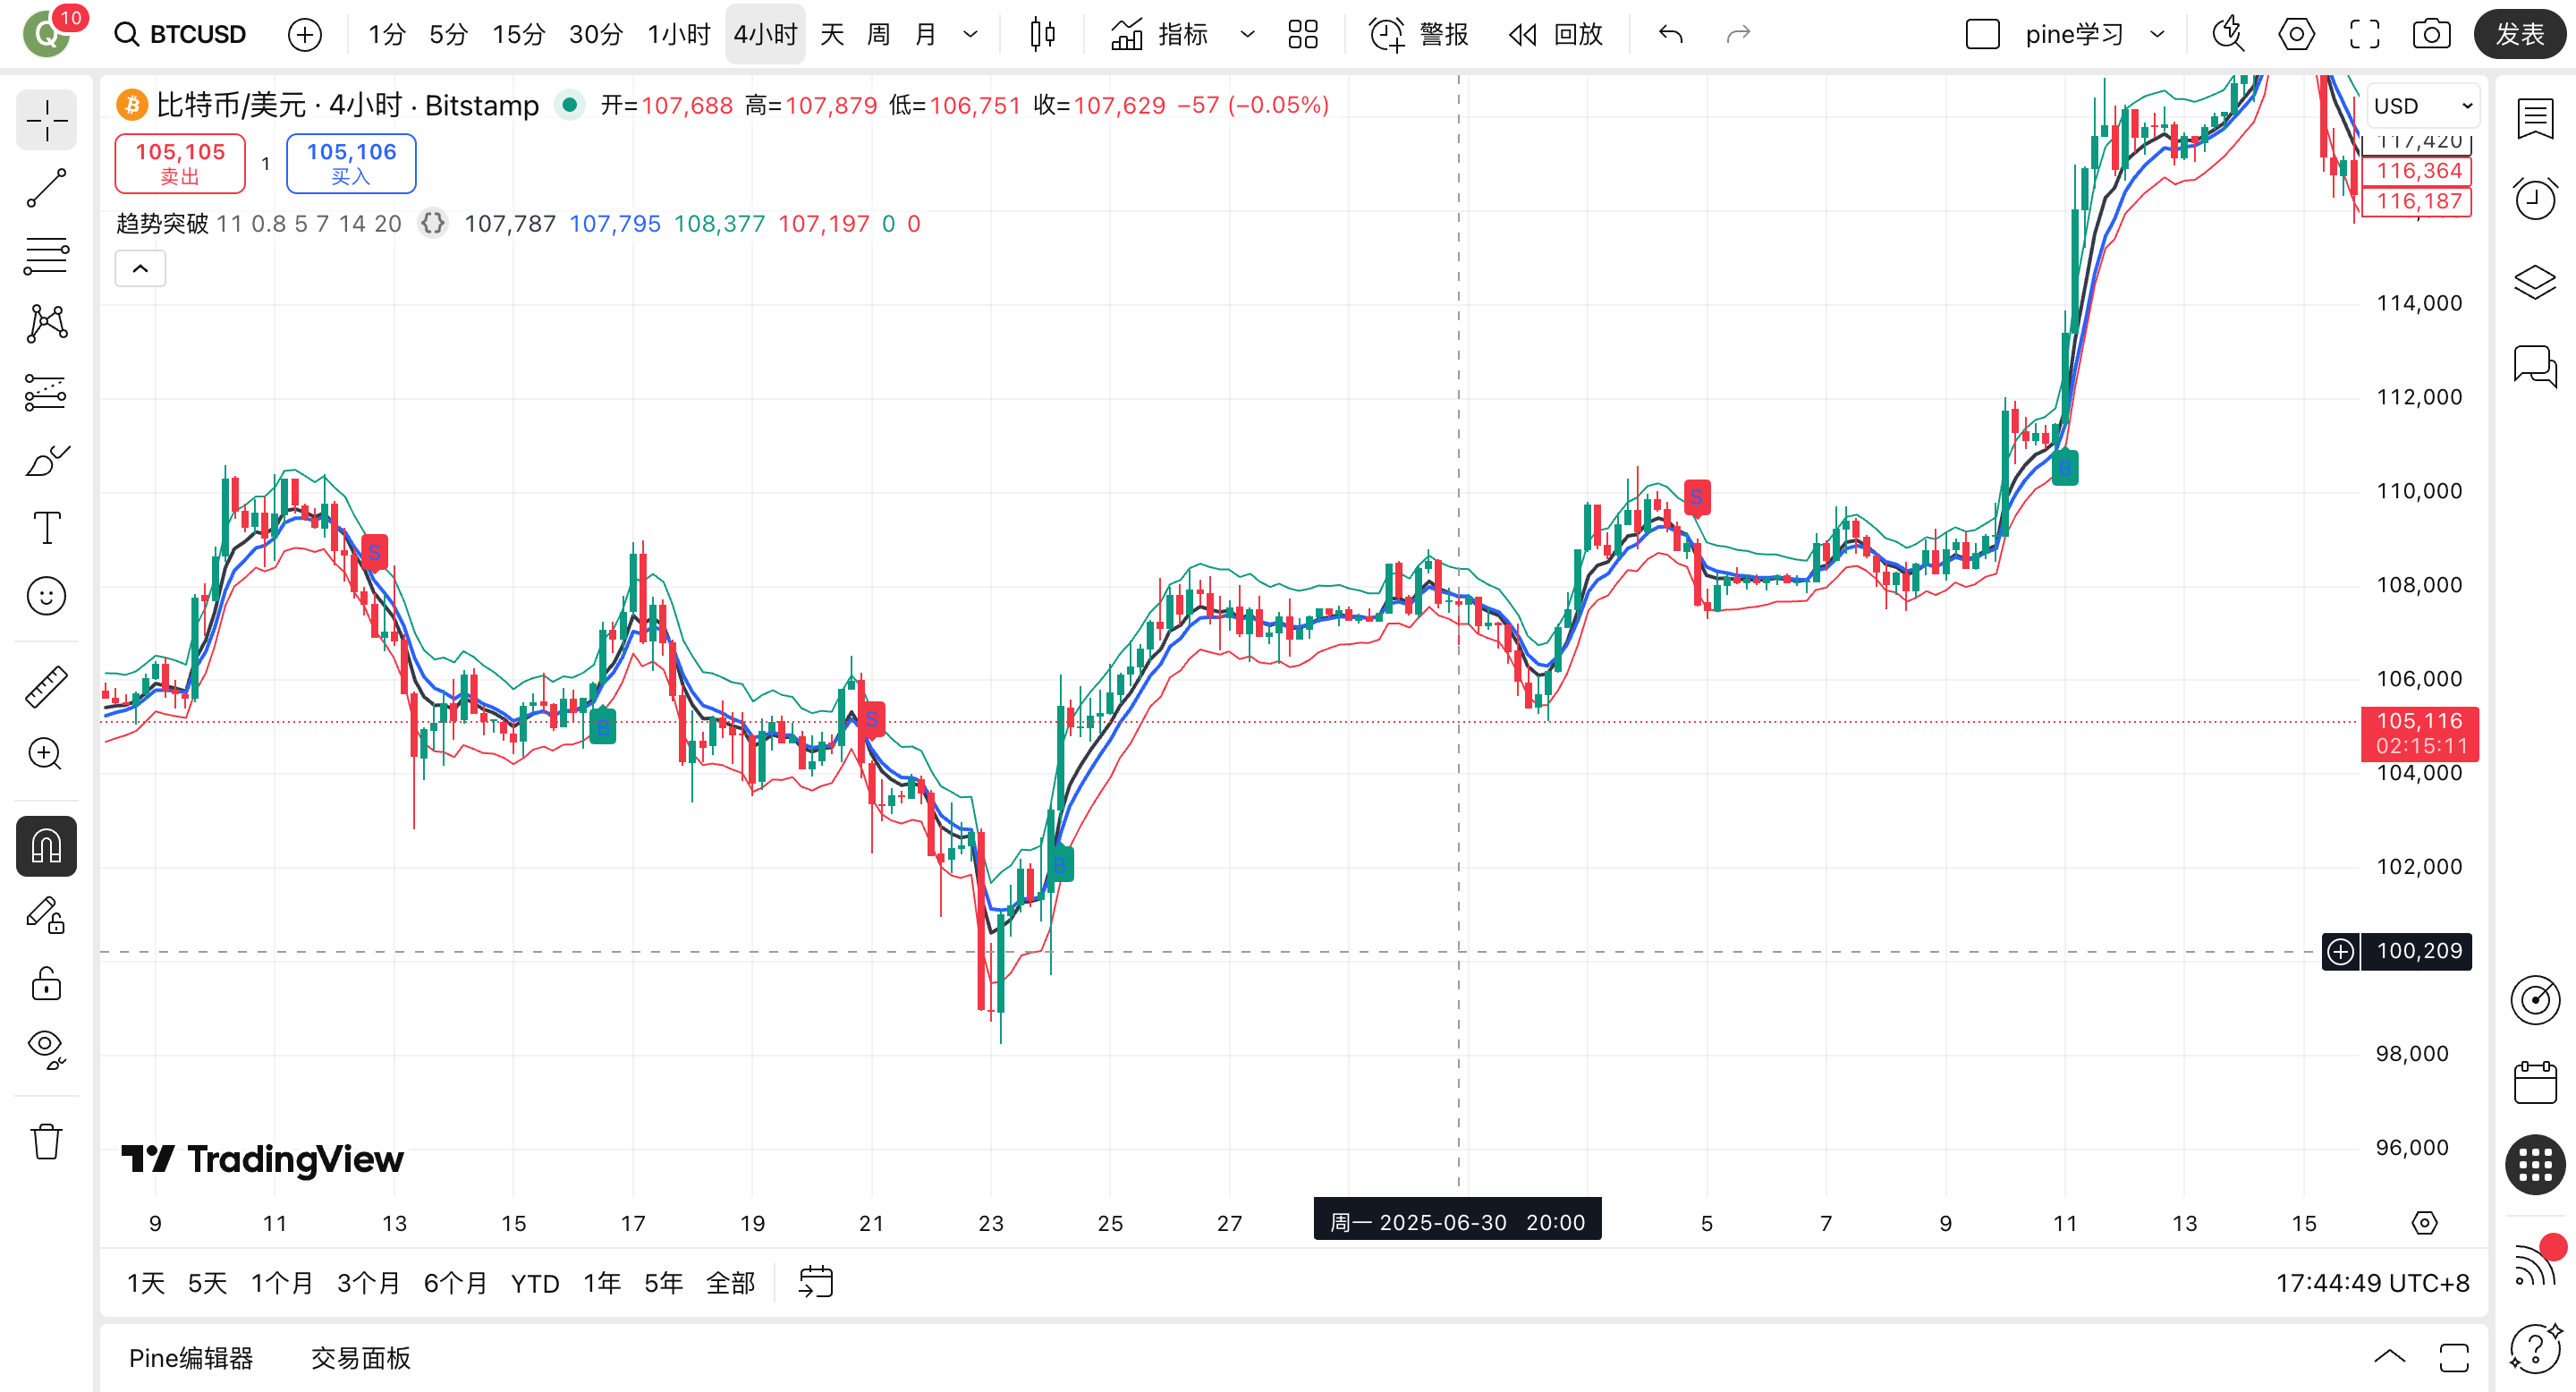
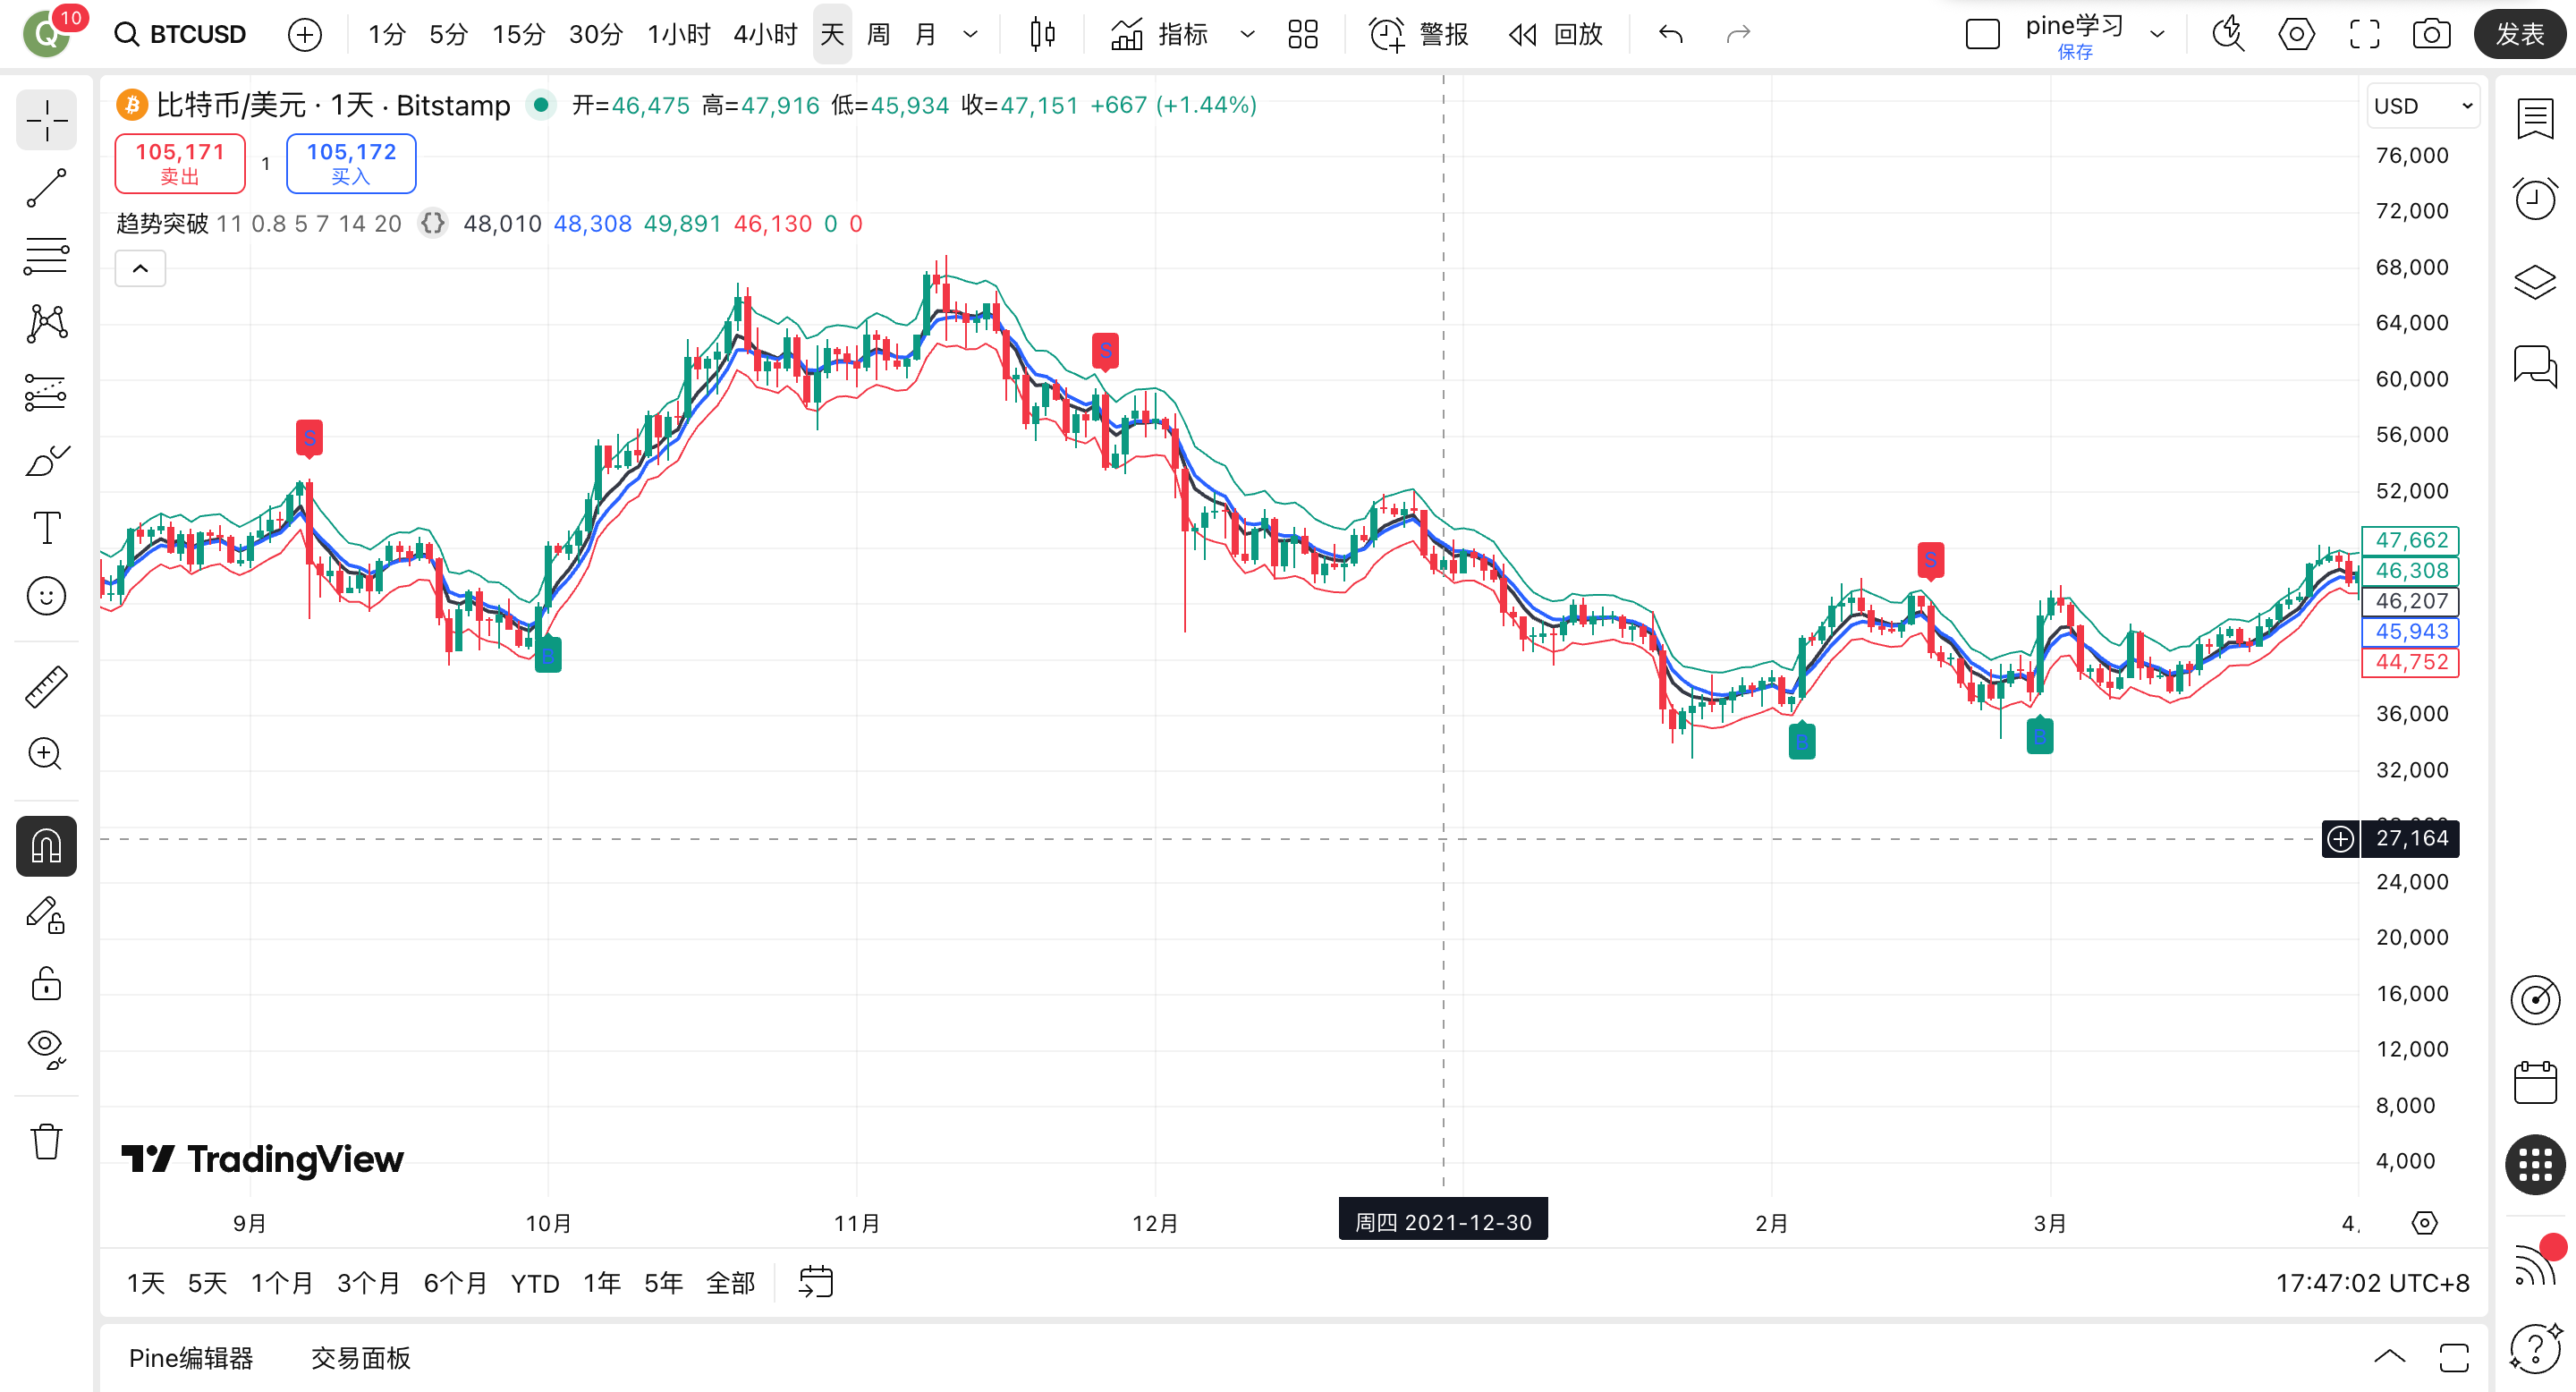
7. Usage Recommendations
Trend Timeframe Selection
- High-frequency strategies: 1–5 minute timeframes.
- Swing trading strategies: 15-minute to 1-hour timeframes.
Take Profit and Stop Loss
- Bullish: Set stop loss below the lower band.
- Bearish: Set stop loss above the upper band.
- Use partial take-profit or trailing stop to lock in profits.
Risk Management Integration
- Adjust ADX threshold: Lower the threshold in low-volatility markets to increase signal sensitivity.
- Avoid entering trades during strong ranging markets or extreme volatility periods.
Trend Breakout Indicator
Currently provided in open-source sharing mode. In the future, it may switch to a subscription model with closed source. Please seize this opportunity.