📘 Comprehensive Analysis of MACD Indicator: From Calculation Logic to Practical Strategies
🧠 Basic Concepts + Principles
MACD (Moving Average Convergence Divergence) is a trend-following momentum indicator proposed by Gerald Appel.
Core Idea:
- Observe the "divergence" and "convergence" between short-term and long-term moving averages.
- Judge trend strength, reversal timing, and buy/sell signals.
MACD consists of three parts:
- DIF Line: Short-term EMA - Long-term EMA (e.g., EMA(12) - EMA(26))
- DEA Line (also known as Signal): 9-day EMA smoothing line of DIF
- MACD Histogram: DIF - DEA, reflecting changes in bullish and bearish forces
Of course, below is a more detailed MACD Indicator Calculation Algorithm Analysis, suitable for inclusion in technical tutorials or quantitative strategy documents:
🧮 Detailed Calculation
📌 Indicator Calculation Algorithm (Using Default Parameters 12, 26, 9 as Example)
MACD (Moving Average Convergence Divergence) indicator reflects the trend strength and reversal signals of prices through the difference between two exponential moving averages (EMA).
Step One: Calculate EMA12 and EMA26
- EMA12 represents the exponential moving average of the recent 12 prices (usually closing prices), with faster response.
- EMA26 is the exponential moving average of the recent 26 prices, with slower response.
The core formula for exponential moving average is:
Where the smoothing coefficient
- For EMA12,
- For EMA26,
Step Two: Calculate DIF Value (also known as MACD Fast Line)
DIF reflects the difference between short-term and long-term trends, representing changes in price momentum.
Step Three: Calculate DEA Value (also known as Signal Line or MACD Slow Line)
DEA is the 9-day EMA of DIF:
- Smoothing coefficient:
- Meaning: Used to smooth the DIF curve and confirm the trend
Step Four: Calculate MACD Histogram (Histogram)
The MACD histogram (also called Histogram) is used to visualize the gap between DIF and DEA:
Multiplied by 2 because the original indicator designer Gerald Appel wanted to amplify the visual effect.
We now use a set of simplified closing prices to manually calculate the three MACD elements (DIF, DEA, MACD Histogram) step by step.
Suitable for understanding the essence of the formula, and also suitable for inclusion in teaching documents or paid courses.
Good, I'll help you make the content more complete and accurate while keeping it clear and easy to understand. Below is the rewritten version, including formulas, detailed calculations, notes, and table display:
🔢 Simulation Example Data (Closing Prices):
[10, 10.2, 10.5, 10.4, 10.7, 10.9, 11.2, 11.5, 11.3, 11.6]Using MACD parameters (12, 26, 9).
For simplicity, initialize EMA12 and EMA26 using the simple moving average (SMA) of the first 6 closing prices, and start calculating from the 7th data point.
📐 Smoothing Coefficient (α) Calculation Formula
MACD uses exponential moving averages (EMA), with different periods corresponding to different smoothing coefficients α, calculated as:
Smoothing coefficient for EMA12:
Smoothing coefficient for EMA26:
Smoothing coefficient for DEA (EMA on DIF):
🧮 Step 1: Initialize EMA12 and EMA26
Use the first 6 closing prices to calculate the simple average as the initial EMA:
📈 Step 2: Start Recursive Calculation from Day 7
EMA recursive formula:
Where:
: Today's closing price : Corresponding EMA smoothing coefficient
Day 7 Closing Price = 11.2
1. Calculate EMA12
2. Calculate EMA26
3. Calculate DIF
4. DEA Initialization
For the first DEA, set it to the DIF value of the day (simplified processing):
5. Calculate MACD Histogram
Day 8 Closing Price = 11.5
1. EMA12
2. EMA26
3. DIF
4. DEA Recursive
5. MACD Histogram
Day 9 Closing Price = 11.3
1. EMA12
2. EMA26
3. DIF
4. DEA
5. MACD Histogram
Day 10 Closing Price = 11.6
1. EMA12
2. EMA26
3. DIF
4. DEA
5. MACD Histogram
✅ Calculation Results Summary Table
| Date | EMA12 | EMA26 | DIF | DEA | MACD Histogram |
|---|---|---|---|---|---|
| Day 7 | 10.564 | 10.503 | 0.061 | 0.061 | 0.000 |
| Day 8 | 10.714 | 10.575 | 0.139 | 0.077 | 0.124 |
| Day 9 | 10.803 | 10.627 | 0.176 | 0.097 | 0.158 |
| Day 10 | 10.927 | 10.697 | 0.230 | 0.124 | 0.212 |
🧠 Explanation and Supplements
DEA Initialization: Usually, the first day uses DIF as the DEA initialization value for simplified calculation; actual software may differ slightly.
MACD Histogram: Some systems display as
DIF - DEA; here multiplied by 2 to amplify the signal for better visualization.EMA Smoothing Coefficient: Larger α makes EMA more responsive to the latest prices; EMA12 is more sensitive than EMA26.
Indicator Meaning:
- Larger DIF indicates short-term trend stronger than long-term trend.
- DEA is the smoothed confirmation line of DIF, used to filter signal noise.
- MACD Histogram reflects changes in bullish and bearish forces; larger bars indicate trend acceleration, smaller bars indicate trend weakening.
🔁 Detailed Explanation of Trading Signals
| Signal Type | Condition | Meaning Explanation | Trading Suggestions |
|---|---|---|---|
| Golden Cross (Long) | DIF crosses above DEA | Bullish trend starts, short-term momentum exceeds long-term momentum | Consider buying or adding positions, bullish entry signal |
| Dead Cross (Short) | DIF crosses below DEA | Bearish trend starts, short-term momentum weakens | Consider selling or shorting, risk control or exit |
| Histogram Turns Red | MACD Histogram turns from negative to positive | Bullish momentum strengthens, buyers start to dominate | Trend reverses upward, suitable for following long |
| Histogram Turns Green | MACD Histogram turns from positive to negative | Bearish momentum strengthens, sellers dominate | Trend reverses downward, suggest reducing or selling |
| Zero Axis Crossover | DIF or DEA crosses above / below 0 axis | Key point for bullish/bearish trend switch, confirms trend direction change | Combine with other indicators to confirm trend, can serve as entry/exit auxiliary signal |
Explanation
- Golden Cross and Dead Cross are the core buy/sell signals of MACD, representing the crossover of short-term and long-term trends.
- Histogram Turns Red/Green is the manifestation of momentum, can capture timing of trend acceleration or weakening.
- Zero Axis Crossover sometimes used to confirm trend strength and direction, especially in oscillating markets with reference value.
- In actual trading, suggest combining volume, price patterns, and other technical indicators for multiple confirmations to avoid false signals.
If needed, I can help you write "Practical Strategy Examples" or "MACD Advanced Usage" sections. Do you need it?
⚖️ Indicator Advantages and Disadvantages
✅ Advantages:
- Smooths Price Fluctuations: Uses exponential moving averages (EMA) to smooth prices, effectively reducing noise and false signals.
- Strong Trend Identification: Can intuitively reflect market trend strength and direction, helping traders grasp buy/sell timings.
- Applicable to Multiple Periods: MACD applies to various time periods and multiple asset classes, with high flexibility.
- Combines Momentum Analysis: Histogram reflects changes in bullish/bearish momentum, helping judge trend acceleration or weakening.
❌ Disadvantages:
- Strong Lag: As a derivative of moving averages, MACD has certain delay in price changes, with late signal generation.
- Poor Performance in Oscillating Markets: In sideways or oscillating conditions, frequent golden and dead crosses, easily leading to frequent trading and losses.
- Fixed Parameters Limit: Commonly used (12, 26, 9) parameters may not apply to all markets, need adjustment based on variety and period for better performance.
- Low Sensitivity to Extreme Conditions: Slow response to sudden sharp fluctuations, possibly missing optimal trading timings.
In practical application, suggest combining MACD with other trend, momentum, or volume indicators to enhance signal accuracy and reliability.
⚠️ Signal Traps and Counter Strategies
| Trap Type | Description | Counter Suggestions |
|---|---|---|
| False Golden Cross | After MACD golden cross signal, price does not continue rising, instead quickly pulls back, leading to misjudging bullish trend | Combine with volume increase to confirm buying force, use trend lines or longer-term moving averages to assist in judging trend direction, avoid chasing highs |
| Dead Cross Rises Instead of Falling | After MACD dead cross signal, price does not fall but rebounds, making bearish signal invalid | Wait for price to break key support levels or confirm downtrend, avoid blindly shorting prematurely |
| Histogram Oscillation | MACD histogram fluctuates continuously near zero axis, red/green bars alternate frequently, signals noisy, direction unclear | Pair with momentum indicators like RSI, ADX to filter oscillating conditions, avoid frequent trading, choose periods with obvious trends |
| Lagging Signals | MACD signals generated late, missing optimal entry or exit timings | Combine with faster responsive indicators (e.g., short-period moving averages, KDJ) for multiple confirmations, improve trading timeliness |
| Parameters Not Applicable | Fixed (12,26,9) parameters not applicable to all markets or periods, leading to large signal errors | Adjust MACD parameters based on target asset volatility characteristics and trading periods, dynamically optimize strategy |
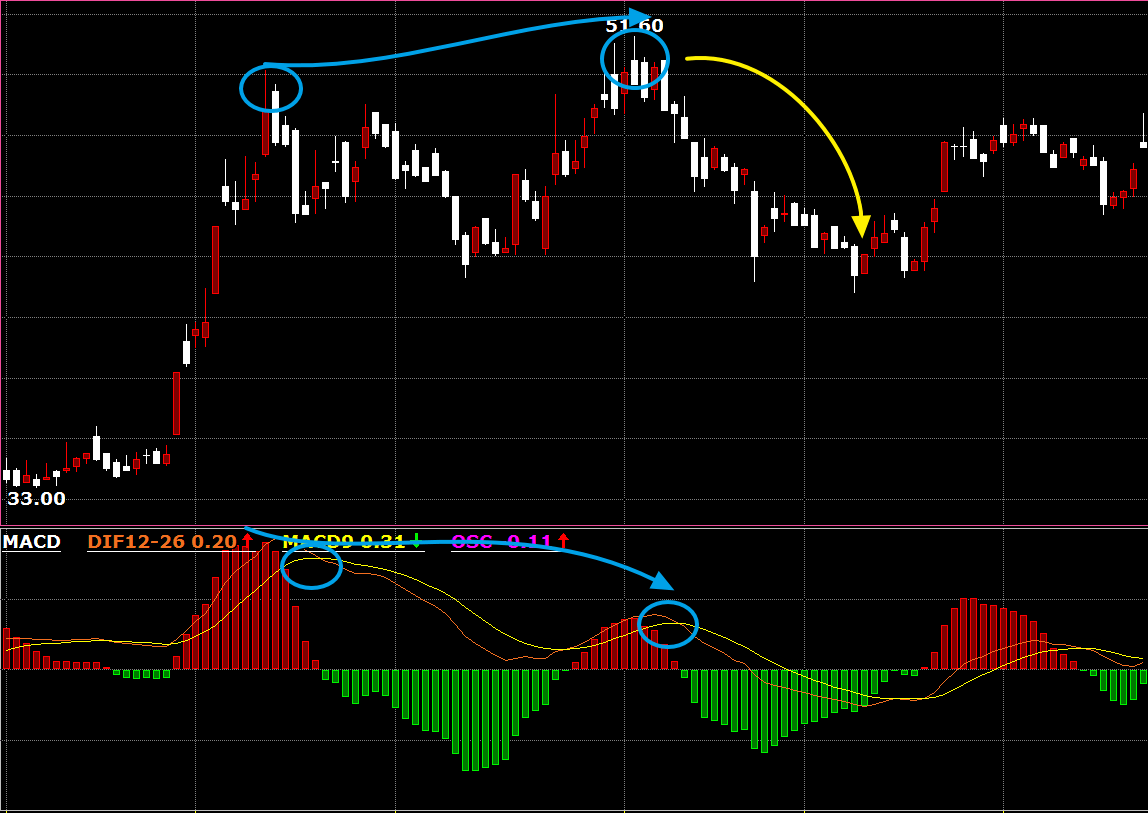
🔍 What is MACD Divergence? How to Find It?
1. What is Divergence?
Divergence is the situation where price trends and indicator trends are "out of sync".
Simply put:
- Price makes new high/low, but MACD does not follow with new high/low
- This implies current trend momentum may weaken, price may reverse or adjust.
2. How to Find Divergence?
First Step: Find Price High Points and Low Points
- High Point: Price at a certain time point higher than its left and right neighbors
- Low Point: Price at a certain time point lower than its left and right neighbors
For example, price sequence:
[10, 11, 10.8, 11.5, 11.3, 10.7, 10, 9.8]- 11 and 11.5 are local high points, because they are higher than adjacent prices
- 10 and 9.8 are local low points, because they are lower than adjacent prices
Second Step: Find MACD Histogram Values Corresponding to These High and Low Points
Corresponding MACD Histogram for price points, for example:
[0.5, 0.8, 0.6, 0.7, 0.65, -0.3, -0.6, -0.5]Third Step: Judge Top Divergence
- Observe two adjacent price high points
- If the later price high point is higher than the previous, but the corresponding MACD Histogram is lower than the previous, it means momentum didn't keep up
- At this time, top divergence appears, price may fall
Fourth Step: Judge Bottom Divergence
- Observe two adjacent price low points
- If the later low point is lower than the previous, but the corresponding MACD Histogram is higher than the previous, it means bearish momentum weakens
- At this time, bottom divergence appears, price may rise
3. Look at the Logic with Pseudocode
prices = [10, 11, 10.8, 11.5, 11.3, 10.7, 10, 9.8]
macd_hist = [0.5, 0.8, 0.6, 0.7, 0.65, -0.3, -0.6, -0.5]

# Find high points (manually given here)
high_indices = [1, 3]  # Prices 11 and 11.5
# Find low points
low_indices = [6, 7]  # Prices 10 and 9.8

# Judge top divergence
if prices[3] > prices[1] and macd_hist[3] < macd_hist[1]:
    print("Top divergence found, price may fall")

# Judge bottom divergence
if prices[7] < prices[6] and macd_hist[7] > macd_hist[6]:
print("Bottom divergence found, price may rise")4. Summary
Divergence is a signal of "disconnection" between price trends and indicator trends, usually a precursor to trend weakening or reversal.
However, divergence is only a warning and cannot guarantee price reversal; comprehensive judgment should combine volume, support/resistance, etc.
Of course! I'll help you make the content more detailed, easier to understand, and more practical:
🧠 Advanced Usage Techniques (Detailed Version)
1. Trend Confirmation Method
- When MACD shows a golden cross (DIF crosses above DEA), and at the same time short-term moving averages (e.g., EMA12 or EMA20) show upward divergence, it indicates a relatively stable bullish trend.
- In this confirmation, if price pulls back to near the moving average, consider going long to reduce false signal risks.
2. Multi-Period Coordination
- First look at daily level, confirm MACD golden cross, confirm large period trend upward.
- Then observe 4-hour period, wait for DIF line to cross above 0 axis, as entry timing.
- This multi-period linkage can enhance signal reliability, avoiding single-period noise interference.
3. Strength Trend Judgment
Observe changes in MACD histogram trend:
- Histogram continuously enlarges indicates strengthening bullish/bearish forces, trend acceleration, consider adding positions or chasing rises along the trend.
- Histogram starts to shrink prompts weakening momentum, should be cautious or prepare to reduce positions.
4. Divergence with RSI Coordination
- Divergence itself is a warning signal, but prone to misjudgment.
- When divergence occurs, if RSI is in extreme zones (above 70 overbought, below 30 oversold), divergence signal effectiveness greatly increases.
- This combination can help filter false signals, increasing operation success rate.
What do you think after this refinement, is it more practical and clear? If needed, I can also help you write demo code or live application cases.
🧪 Case Practical: Freqtrade Strategy Integration
SimpleMACDStrategy is a basic trend-following strategy based on the MACD indicator. It mainly uses the crossover of MACD line and signal line to judge buy/sell timings:
- Buy Signal: When MACD line crosses from below to above the signal line (i.e., golden cross), and MACD line is in positive zone, indicating bullish trend start, execute buy.
- Sell Signal: When MACD line crosses from above to below the signal line (dead cross), consider closing and selling.
This strategy is simple and easy to understand, suitable for capturing medium-short term trends, but since it relies on a single indicator, may generate more misjudgments in oscillating conditions, need to combine with other indicators or filter conditions to improve accuracy.
import talib.abstract as ta
from freqtrade.strategy.interface import IStrategy
from pandas import DataFrame

class SimpleMACDStrategy(IStrategy):
    # Minimal ROI, phased profit-taking
    minimal_roi = {
        "60": 0.08,
        "30": 0.05,
        "0": 0.10
    }

    # Stoploss ratio, 3%
    stoploss = -0.03

    # 1-hour period
    timeframe = '1h'

    # Process only new candles, reduce repeated calculations
    process_only_new_candles = True

    def populate_indicators(self, dataframe: DataFrame, metadata: dict) -> DataFrame:
        # Calculate MACD and signal line, histogram
        macd, macdsignal, macdhist = ta.MACD(dataframe['close'], fastperiod=12, slowperiod=26, signalperiod=9)
        dataframe['macd'] = macd
        dataframe['macdsignal'] = macdsignal
        dataframe['macdhist'] = macdhist
        return dataframe

    def populate_entry_trend(self, dataframe: DataFrame, metadata: dict) -> DataFrame:
        # Golden cross and MACD > 0 considered long signal
        dataframe.loc[
            (dataframe['macd'] > dataframe['macdsignal']) &
            (dataframe['macd'] > 0),
            'enter_long'] = 1
        return dataframe

    def populate_exit_trend(self, dataframe: DataFrame, metadata: dict) -> DataFrame:
        # Dead cross or MACD < 0 considered exit signal
        dataframe.loc[
            (dataframe['macd'] < dataframe['macdsignal']) |
            (dataframe['macd'] < 1),
            'exit_long'] = 1
return dataframeThis backtest result shows that the SimpleMACDStrategy strategy executed 59 trades during the test period:
- Average Per-Trade Profit % is -0.06%, slightly loss-making, indicating limited overall profitability.
- Total Profit is -13.187 USDT, overall loss about 1.32%, indicating failure to achieve positive returns.
- Average Duration is 11 hours 28 minutes, belonging to medium-short term strategy.
- Win Rate is 42.4%, win rate below 50%, low trading success rate.
- Max Drawdown is 49.466 USDT, about 4.77%, moderate drawdown but need to monitor risks.
Overall, this strategy based on single MACD indicator performs weakly, possibly due to excessive signal noise, obvious lag impact, etc.
🧾 Indicator Summary + Practical Suggestions
MACD Indicator Advantages MACD is a momentum indicator combining short-term and long-term trends, particularly suitable for identifying trending markets, helping traders judge market bullish/bearish force comparisons and trend strength. It shows changes in bullish/bearish momentum through the crossover of DIF (fast line) and DEA (slow line), as well as MACD histogram. MACD has better trend-tracking effect on medium-long periods (e.g., daily, 4-hour), and can filter some price noise.
Not Recommended for Standalone Use Although MACD is powerful, as a lagging indicator, prone to false signals in oscillating conditions. Relying solely on MACD easily leads to frequent entries/exits and losses. Therefore, suggest combining with other auxiliary indicators, such as:
- EMA (Exponential Moving Average): Confirm trend direction, pair with MACD to filter false signals.
- RSI (Relative Strength Index): Judge overbought/oversold states, assist take-profit/stop-loss.
- Volume Indicators: Confirm true effectiveness of momentum, avoid false breakouts.
Strategy Combination Examples To improve trading success rate, can design multi-indicator coordinated strategies, for example:
MACD Golden Cross + EMA Uptrend: When MACD fast line (DIF) crosses above slow line (DEA) and both are above zero axis, with EMA showing uptrend, enter long, follow the trend.
MACD Dead Cross + RSI Overbought Zone: When MACD fast line crosses below slow line, and RSI value above 60 (showing short-term overbought), suitable for taking profit at highs or considering reversal short, reducing risks.
Parameter Adjustment Suggestions Default MACD parameters (12, 26, 9) are the most commonly used and long-tested configurations in the market, suitable for most varieties and medium-long periods.
- For high-frequency trading or extremely short periods (e.g., 1-minute, 5-minute), can appropriately adjust parameters to (5, 13, 5), etc., making indicator more sensitive to price changes, faster response to market fluctuations.
- Different markets and varieties have different characteristics, suggest optimizing parameters through backtesting to find configurations suitable for your trading targets and style.
In summary, MACD is an important tool for trend traders, but needs reasonable combination with other indicators and risk management measures to improve win rate and return stability in volatile markets.