📘 Full Analysis of the KDJ Indicator: From Principles and Calculations to Quantitative Practice
I. ✅ Basic Concepts
The KDJ indicator, also known as the Stochastic Oscillator, was proposed by George Lane in the 1950s. It is a momentum indicator used to measure the position of the current price relative to the high–low range over a given period. KDJ extends the traditional KD indicator by introducing the J value to strengthen signal intensity.
K Value: Reflects short-term price fluctuations
D Value: A smoothed moving average of K
J Value:
J = 3×K − 2×D, strengthening overbought/oversold signalsRSV (Raw Stochastic Value): An important intermediate value in the calculation of KDJ. It is a percentage that represents the current price’s position within the recent trading range.
- RSV close to 100 → Price near recent high (overbought).
- RSV close to 0 → Price near recent low (oversold).
- RSV is the foundation for calculating K and D, which are smoothed to form the KDJ indicator.
II. 🧮 Calculation Details
📌 Calculation Algorithm
Using a 9-day KDJ as an example:
- Calculate RSV (Raw Stochastic Value):
RSV = (Close - Lowest Low) / (Highest High - Lowest Low) * 100- Initialize K and D values (commonly set to 50), then update recursively:
K = (2/3) * K_prev + (1/3) * RSV
D = (2/3) * D_prev + (1/3) * K- Calculate J value:
J = 3 * K - 2 * DLet’s simulate a complete KDJ calculation and display the daily RSV, K, D, and J results in an Excel-style table.
III. 🧮 Complete KDJ Calculation Example (9-day Period)
- Initial values: K₀ = D₀ = 50
- Simulate 10 days of data
- Assume High, Low, and Close prices are known
📊 Sample Data
| Day | Close | 9-day Low | 9-day High | RSV Formula | RSV |
|---|---|---|---|---|---|
| 1 | 98 | 90 | 110 | (98-90)/(110-90)*100 | 40.00 |
| 2 | 102 | 90 | 110 | (102-90)/(110-90)*100 | 60.00 |
| 3 | 100 | 90 | 110 | (100-90)/(110-90)*100 | 50.00 |
| 4 | 108 | 90 | 110 | (108-90)/(110-90)*100 | 90.00 |
| 5 | 107 | 90 | 110 | (107-90)/(110-90)*100 | 85.00 |
| 6 | 105 | 90 | 110 | (105-90)/(110-90)*100 | 75.00 |
| 7 | 102 | 90 | 110 | (102-90)/(110-90)*100 | 60.00 |
| 8 | 100 | 90 | 110 | (100-90)/(110-90)*100 | 50.00 |
| 9 | 95 | 90 | 110 | (95-90)/(110-90)*100 | 25.00 |
| 10 | 92 | 90 | 110 | (92-90)/(110-90)*100 | 10.00 |
🧾 K, D, J Iteration
Initialization:
K₀ = 50,D₀ = 50Formula:
Kₙ = 2/3 × Kₙ₋₁ + 1/3 × RSVₙ
Dₙ = 2/3 × Dₙ₋₁ + 1/3 × Kₙ
Jₙ = 3 × Kₙ − 2 × Dₙ| Day | RSV | K Calculation | K | D Calculation | D | J |
|---|---|---|---|---|---|---|
| 1 | 40 | 2/3×50 + 1/3×40 | 46.67 | 2/3×50 + 1/3×46.67 | 48.89 | 41.56 |
| 2 | 60 | 2/3×46.67 + 1/3×60 | 51.11 | 2/3×48.89 + 1/3×51.11 | 49.63 | 55.07 |
| 3 | 50 | 2/3×51.11 + 1/3×50 | 50.74 | 2/3×49.63 + 1/3×50.74 | 50.00 | 52.22 |
| 4 | 90 | 2/3×50.74 + 1/3×90 | 63.83 | 2/3×50.00 + 1/3×63.83 | 54.61 | 79.44 |
| 5 | 85 | 2/3×63.83 + 1/3×85 | 70.89 | 2/3×54.61 + 1/3×70.89 | 60.04 | 92.60 |
| 6 | 75 | 2/3×70.89 + 1/3×75 | 72.26 | 2/3×60.04 + 1/3×72.26 | 64.11 | 88.29 |
| 7 | 60 | 2/3×72.26 + 1/3×60 | 68.17 | 2/3×64.11 + 1/3×68.17 | 65.46 | 71.79 |
| 8 | 50 | 2/3×68.17 + 1/3×50 | 62.11 | 2/3×65.46 + 1/3×62.11 | 64.34 | 57.63 |
| 9 | 25 | 2/3×62.11 + 1/3×25 | 49.41 | 2/3×64.34 + 1/3×49.41 | 59.36 | 30.92 |
| 10 | 10 | 2/3×49.41 + 1/3×10 | 36.27 | 2/3×59.36 + 1/3×36.27 | 51.66 | 9.22 |
📉 Line Chart
K Value: Red curveD Value: Blue curveJ Value: Green curve (usually most volatile)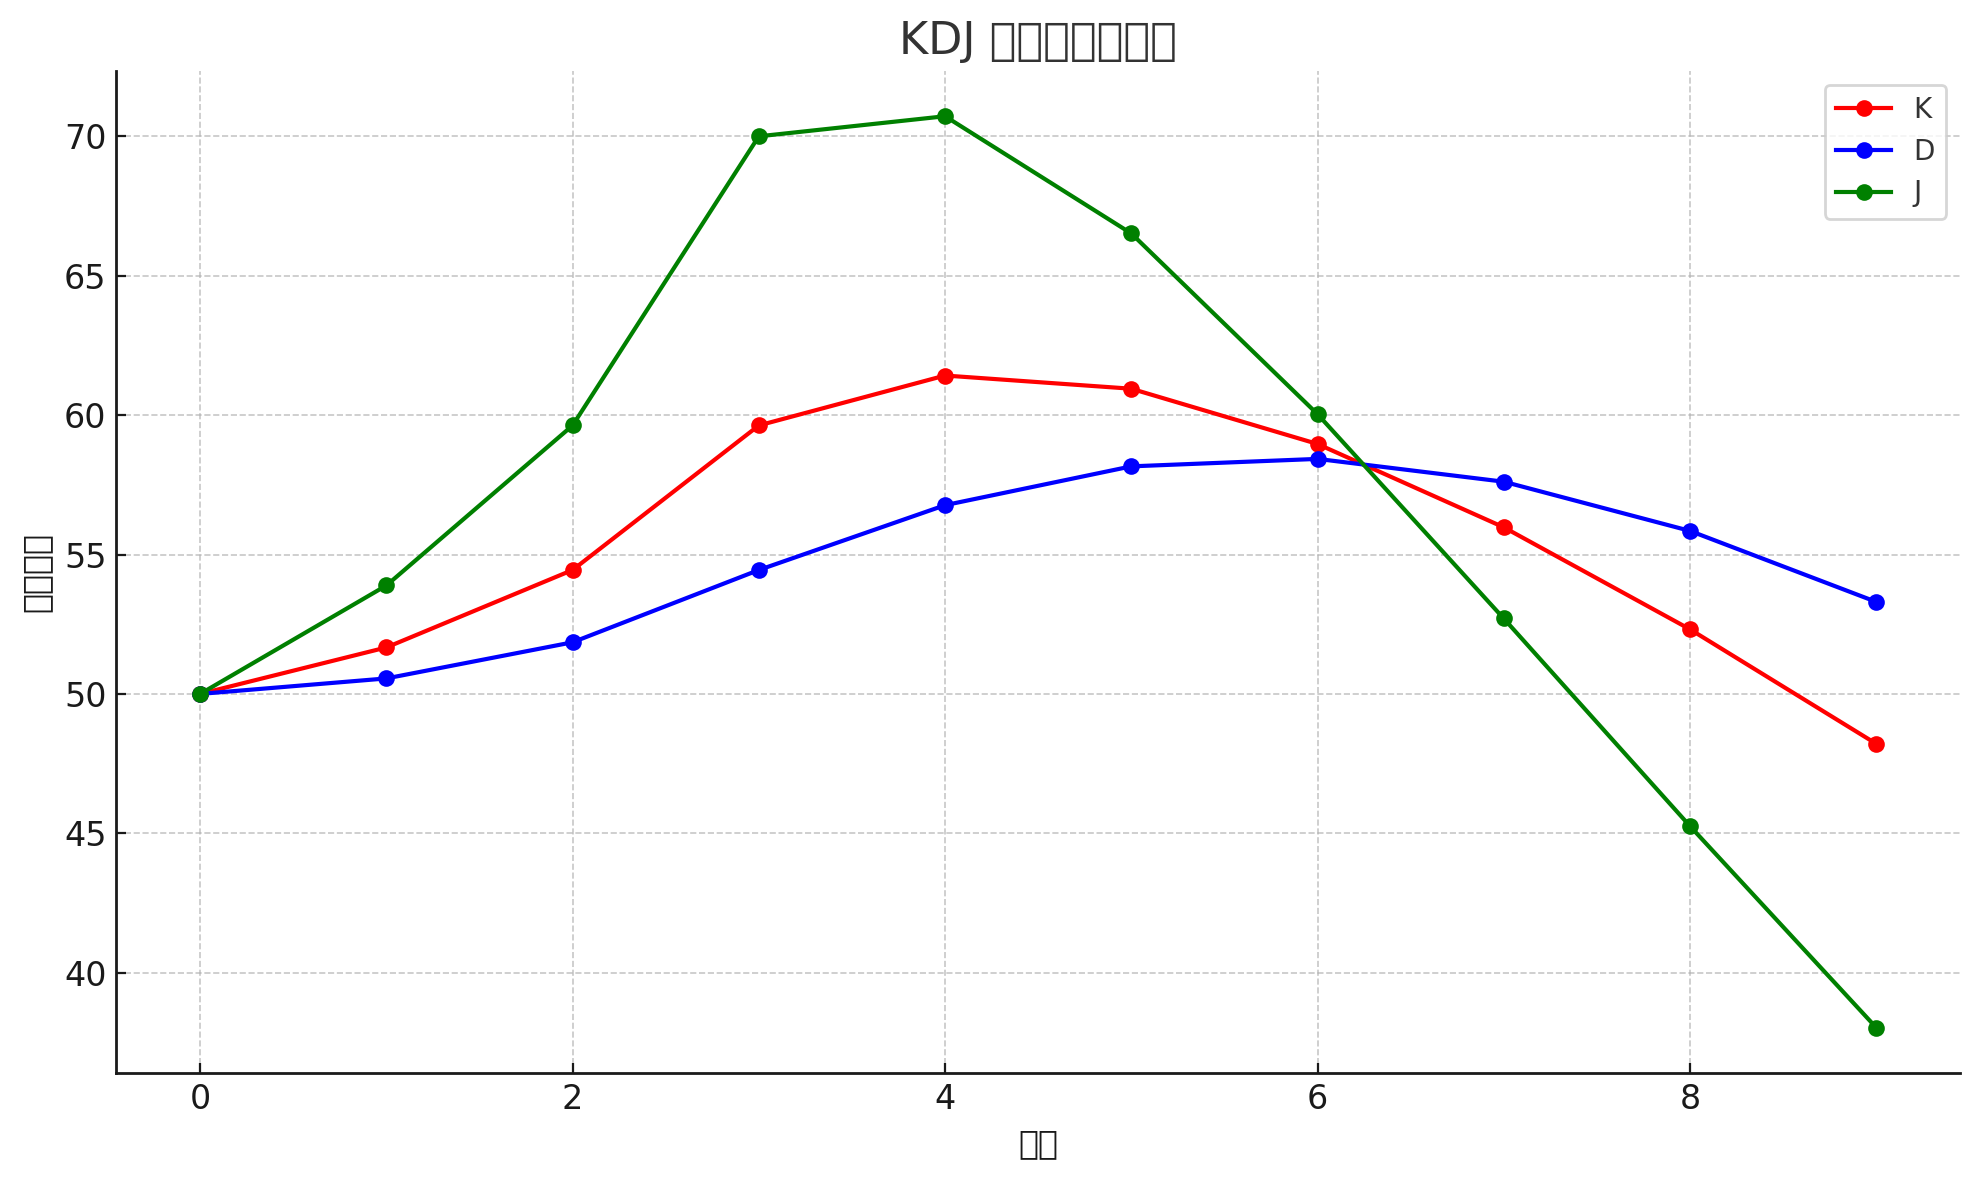
✅ Observations
- Day 4 → Obvious surge (K rising quickly) → Golden Cross signal
- Day 9–10 → J value drops rapidly → Oversold warning
- Day 10 → Possible rebound attempt, but requires trend confirmation
IV. 🔁 Trading Signals (KDJ)
| Signal Type | Condition | Meaning/Interpretation | Suggested Action |
|---|---|---|---|
| Golden Cross | K crosses above D | Short-term bullish momentum | Buy signal; confirm with volume/trend indicators (e.g., MA, MACD) |
| Death Cross | K crosses below D | Short-term weakening, possible drop | Sell/exit signal; stronger at uptrend peaks |
| J > 100 | J exceeds 100 (can break 100) | Market extremely overbought | Not an immediate sell; watch for reversal signals (death cross, etc.) |
| J < 0 | J falls below 0 (can drop below) | Market extremely oversold | Not an immediate buy; wait for Golden Cross or support confirmation |
| High Death Cross | K/D > 80, Death Cross | Strong sell signal | Consider exit/short, especially at trend tops |
| Low Golden Cross | K/D < 20, Golden Cross | Strong buy signal | Consider long/entry, especially near support |
🧠 Notes
- The J line is most volatile and very sensitive to price moves, making it useful for overbought/oversold detection.
- K/D crossovers are core buy/sell signals, but are prone to noise in sideways markets; use with trend filters (e.g., EMA, ADX).
- Crossovers in extreme zones are more reliable; mid-range signals require caution.
V. ⚖️ Advantages & Disadvantages of KDJ
✅ Advantages
| Advantage | Details |
|---|---|
| Highly sensitive | Captures short-term sentiment quickly, especially via J’s sharp fluctuations; suitable for short-term traders. |
| Clear signals | Easy-to-read Golden Cross, Death Cross, J extremes; beginner-friendly and easy for algorithmic rules. |
| Dual adaptability | Can reflect both trend strength (via K/D) and range oscillations (via frequent crossovers). |
| Identifies extremes | J > 100 or J < 0 provides intuitive signals of market overheating/overselling. |
| Works well with other indicators | Often combined with RSI, MACD, Bollinger Bands for robust systems. |
❌ Disadvantages
| Disadvantage | Details |
|---|---|
| Overly sensitive to noise | Frequent false signals in sideways markets; J line fluctuates too much. |
| Still lagging | K/D smoothing causes delays; early reversals may be missed. |
| Poor in strong trends | J can stay extreme (>100 or <0) for long periods without reversal. |
| Fixed parameters | Common (9,3,3) settings may not suit all assets/timeframes. |
| Ignores volume | Based only on price; lacks context from market flows. |
🧠 Usage Recommendations
Best suited for: short-term range trading, catching rebounds, or exit timing when paired with trend tools.
Not suitable as a standalone: trend identification or sole buy/sell signal in strong trends.
Suggested combinations:
- RSI, MACD → confirm trends
- Support/resistance, Bollinger Bands → improve win rate
- Threshold filtering → e.g., only trade Golden Cross when K/D < 30
VI. ⚠️ KDJ Signal Traps & Countermeasures
| Trap Type | Example Situation | Cause | Solution |
|---|---|---|---|
| False Golden Cross | Frequent K above D in a range, no price rise | Market is sideways; crossovers meaningless | Use trend filter (EMA, Bollinger); only trust low-zone Golden Cross (<30) |
| False Death Cross | K below D but price keeps rising | Uptrend pullbacks trigger false signals | Only trust if also breaking trendline/MA; more reliable at highs |
| J Fluctuation Noise | J swings wildly in ranges without price change | Amplification of K–D difference | Ignore mid-zone J (40–60); only act at extremes |
| Overbought but no drop | J > 100 but price keeps rising | Strong trend continues, KDJ premature | Don’t short blindly; follow trend, check MACD divergence |
| Oversold but no rebound | J < 0 but price keeps falling | Weak market, rebound not triggered | Wait for divergence, volume increase, MACD Golden Cross |
| Multi-timeframe conflict | Daily KDJ Golden Cross, 4H Death Cross | Signals differ across timeframes | Trade with main timeframe, use lower timeframe as reference |
Here’s the English translation of your KDJ strategy guide, keeping the structure, technical terms, and examples intact:
🧠 Strategy Recommendations
| Strategy Name | Core Idea | Example Explanation |
|---|---|---|
| Trend Filter | Only follow KDJ signals in the direction of a clear trend to avoid counter-trend trades | If EMA(20) is rising, only trust golden cross signals; if EMA is falling, only trust death cross signals |
| Extreme Value Strategy | Consider signals only when K/D are extremely low (<20) or high (>80) to improve accuracy | K, D < 20 and a golden cross occurs, more likely to be a true reversal |
| Multi-Indicator Confirmation | Use RSI, MACD, Bollinger Bands, etc., to confirm signal alignment and improve win rate | Enter only if KDJ golden cross + MACD golden cross + RSI crosses above 50 |
| Structure & Pattern Validation | Combine with price structures like triangle breakouts, head & shoulders, or box edges to decide entry/exit | Golden cross appearing at a support level or previous platform bottom is more reliable |
| Multi-Timeframe Usage | Use higher timeframe to determine trend, lower timeframe for precise entry timing | Daily trend upward, enter on 4H golden cross; daily sideways, ignore 30min signals |
📌 Practical Tips
- J overbought is not a sell signal; J oversold is not a buy signal — actual decisions depend on K and D trends and the underlying price structure.
- Sideways markets are the riskiest for KDJ; use smoother indicators like MACD in these conditions.
- In high-frequency short-term strategies (e.g., Freqtrade), KDJ can be used for “swing capturing,” but always adjust dynamically according to market state.
VII. 🧠 Advanced KDJ Usage: Make the Indicator a Multi-Functional Tool
1. Multi-Timeframe Alignment: Major & Minor Timeframes for Higher Accuracy
Technique Use a higher timeframe to determine the trend, and a lower timeframe to find precise entry points, avoiding counter-trend trades and false signals.
Principle Trends often start on lower timeframes and gradually propagate to higher timeframes. Signals aligned across multiple timeframes significantly improve accuracy and win rate.
Practical Example Daily chart shows a KDJ golden cross with K < 30, indicating a mid-term accumulation area; wait for a 4H KDJ golden cross with a volume breakout above the previous high to enter; take-profit can be set near previous highs or Bollinger Band upper band.
Notes Higher timeframe determines direction; lower timeframe determines timing. If the higher timeframe has no clear trend, lower timeframe signals may just be noise. Avoid extremely wide timeframe gaps, e.g., monthly vs. 15min, which may produce distorted signals.
2. Combining with Bollinger Bands: Filter Strong Signals in Overbought/Oversold Areas
Technique Use Bollinger Bands to limit price range and combine with KDJ to filter noise and improve extreme-level signal accuracy.
Principle KDJ is an oscillator, while Bollinger Bands represent price ranges. Together, they precisely identify extreme buying and selling zones.
Practical Example When KDJ golden cross occurs and price touches the lower Bollinger Band, it forms a support resonance signal, suitable for buying. Conversely, a KDJ death cross near the upper band is a strong short signal.
Notes Narrow Bollinger Bands indicate sideways markets; KDJ signals are frequent and often invalid. Expanding bands indicate stronger trends; prioritize trend-following and ignore some overbought/oversold signals.
3. Trendlines or Support/Resistance: Structure Break + Momentum Confirmation
Technique When price breaks a key trendline or support/resistance, KDJ confirming the move gives the strongest signal.
Principle Technical structure breaks are the core logic of trading; KDJ momentum confirmation validates the effectiveness of the breakout.
Practical Example Daily downtrend line is broken and KDJ simultaneously forms a golden cross, confirming a valid breakout for long entry. Or near resistance, price oscillates with KDJ death cross plus volume drop, confirming short entry.
Notes Trendlines must connect at least two points to be valid. It’s best to confirm momentum with MACD or volume. Beware of false breakouts, e.g., KDJ golden cross without volume or weak candle bodies may be a bull trap.
4. Other Recommended Techniques
KDJ Divergence with Elliott Waves A death cross on wave 5 signals a strong reversal.
Volume Confirmation KDJ golden cross with rising volume confirms strong entry momentum.
Second Golden Cross in Overbought Zone If the first golden cross fails, a second one often indicates a true start.
Using J to Identify Extreme Reversals When J < 0 for an extended period, a subsequent golden cross confirms a bottom.
VIII. 📈 Freqtrade Strategy Example: TalibKDJStrategy
from freqtrade.strategy import IStrategy
from pandas import DataFrame
import talib.abstract as ta

class TalibKDJStrategy(IStrategy):
    timeframe = '1h'

    minimal_roi = {
        "0": 0.05,
        "20": 0.03,
        "60": 0.01
    }

    stoploss = -0.05

    def populate_indicators(self, dataframe: DataFrame, metadata: dict) -> DataFrame:
        slowk, slowd = ta.STOCH(
            dataframe['high'],
            dataframe['low'],
            dataframe['close'],
            fastk_period=9,
            slowk_period=3,
            slowk_matype=0,
            slowd_period=3,
            slowd_matype=0
        )
        dataframe['kdj_k'] = slowk
        dataframe['kdj_d'] = slowd
        dataframe['kdj_j'] = 3 * dataframe['kdj_k'] - 2 * dataframe['kdj_d']
        return dataframe

    def populate_entry_trend(self, dataframe: DataFrame, metadata: dict) -> DataFrame:
        dataframe.loc[
            (dataframe['kdj_k'] > dataframe['kdj_d']) &
            (dataframe['kdj_k'].shift(1) <= dataframe['kdj_d'].shift(1)),
            'enter_long'
        ] = 1
        return dataframe

    def populate_exit_trend(self, dataframe: DataFrame, metadata: dict) -> DataFrame:
        dataframe.loc[
            (dataframe['kdj_k'] < dataframe['kdj_d']) &
            (dataframe['kdj_k'].shift(1) >= dataframe['kdj_d'].shift(1)),
            'exit_long'
        ] = 1
return dataframe📊 Freqtrade Backtest Report: TalibKDJStrategy
Backtest period: 2024-06-01 00:00 → 2024-07-01 00:00 Max simultaneous positions: 2
🧾 Strategy Performance Summary
Using KDJ alone carries considerable risk.
| Metric | Data |
|---|---|
| 📈 Strategy Name | TalibKDJStrategy |
| 🔁 Number of Trades | 192 trades |
| 💹 Average Return | -0.52% |
| 💰 Total P/L (USDT) | -281.40 USDT |
| 📉 Total Return | -28.14% |
| ⏱️ Average Holding Time | 3h 27m |
| 🧠 Win/Loss/Draw | 29 / 0 / 163 |
| 🏆 Win Rate | 15.1% |
| 📉 Max Drawdown | 279.81 USDT (28.03%) |
IX. 🧾 Summary
KDJ is simple and intuitive, particularly suitable for short-term trades in oscillating markets. However, backtests show that relying solely on KDJ results in low win rate and negative returns. Key takeaways:
- Do not rely on a single indicator; KDJ is better used as a supporting signal.
- Trend confirmation is crucial; combine with EMA or MACD to avoid frequent stop losses in counter-trend trades.
- Optimize parameters and timeframes according to market characteristics, e.g., 15min for high-volatility intraday markets, 4H for longer-term targets.
- Multi-factor confirmation improves signal quality, e.g., combine Bollinger Bands and RSI to filter false signals, significantly increasing strategy stability.